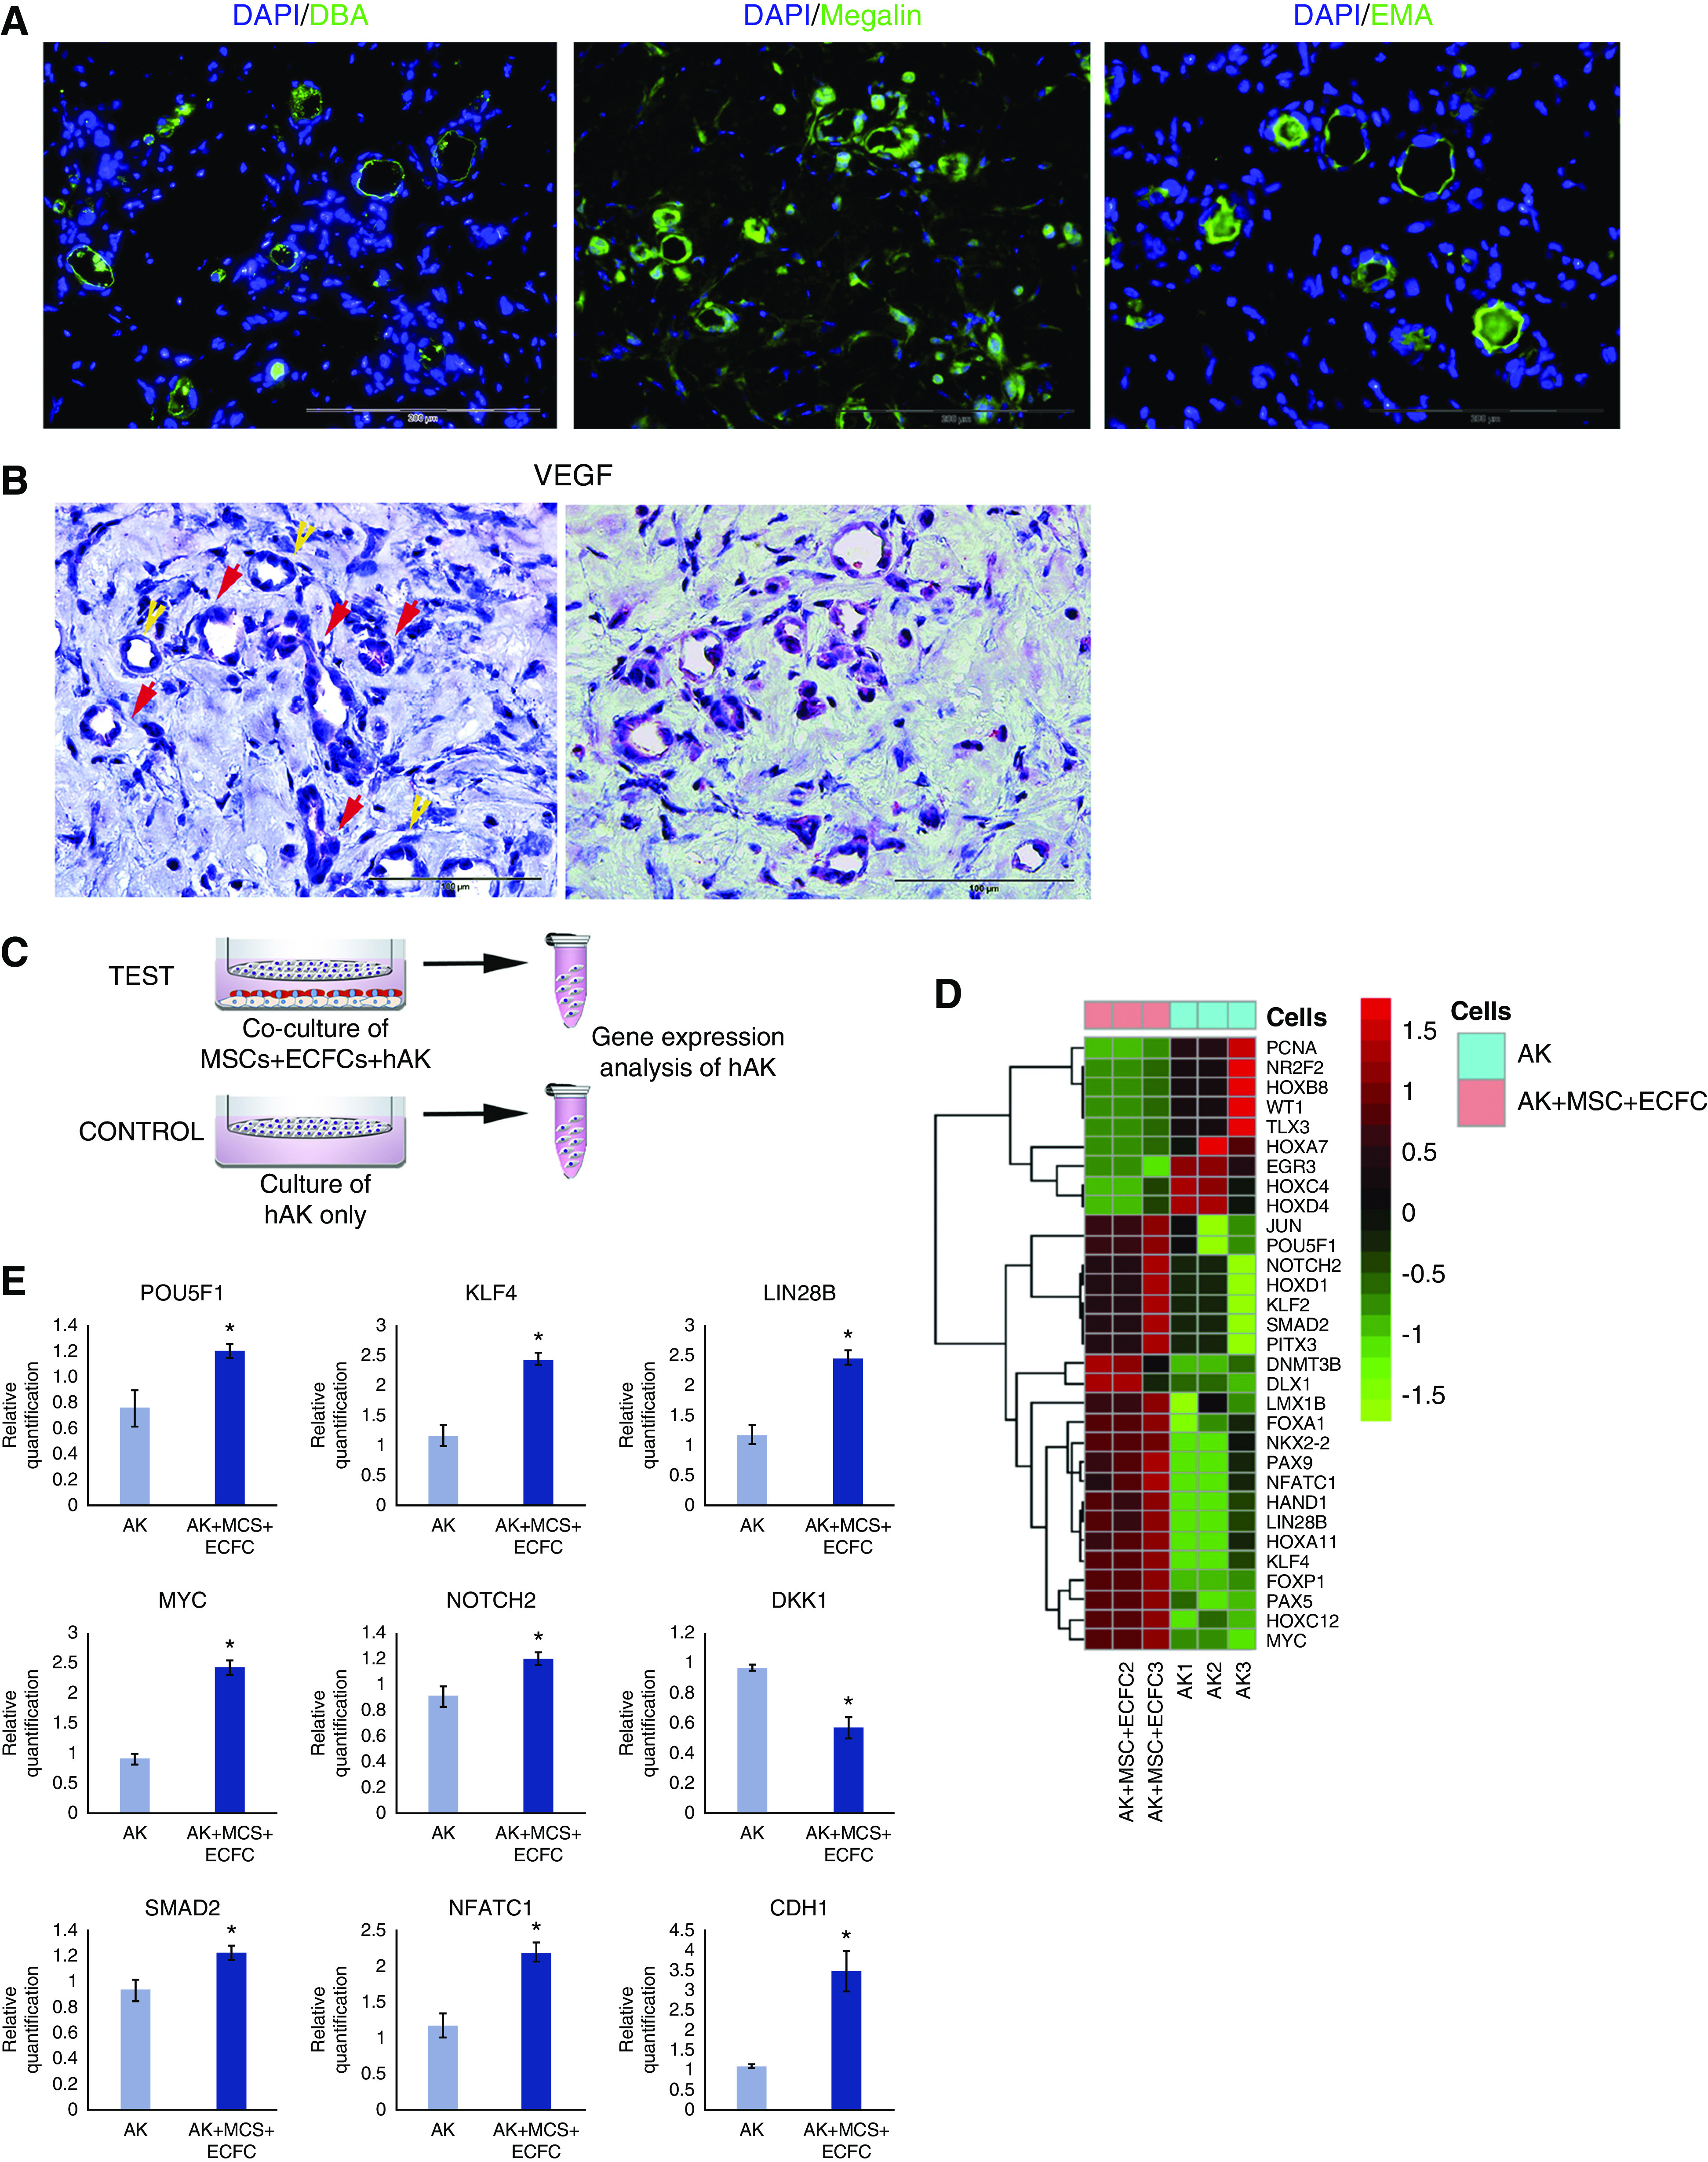
Figure 3.

Characterization of hAK cell–derived tubules and analysis of paracrine effects of MSCs and ECFCs on hAK cells. (A) Immunofluorescence staining of grafts generated from hAK cells, MSCs, and ECFCs injected subcutaneously into NOD-SCID mice for the proximal tubule marker Megalin and distal tubule markers DBA and EMA. Scale bars, 200 μm. (B) IHC staining of mixed grafts for VEGFA, showing strong VEGFA expression in virtually all nascent vessels, demonstrating a perivascular distribution (red arrows), in proximity to renal tubules (yellow arrows). Scale bars, 100 μm. (C) Experimental scheme: hAK cells were cultured either alone (CONTROL), or with MSCs and ECFCs (TEST) in a Transwell setting for 72 hours, after which the gene expression of the two groups was compared via a real time PCR array of stem related transcription factors. (D) Heat map of gene expression. Colors indicate z-score of RQ values. (E) Relative expression of selected genes in hAK cells grown alone or alongside MSCs and ECFCs. *P<0.05 (two-tailed t test).
