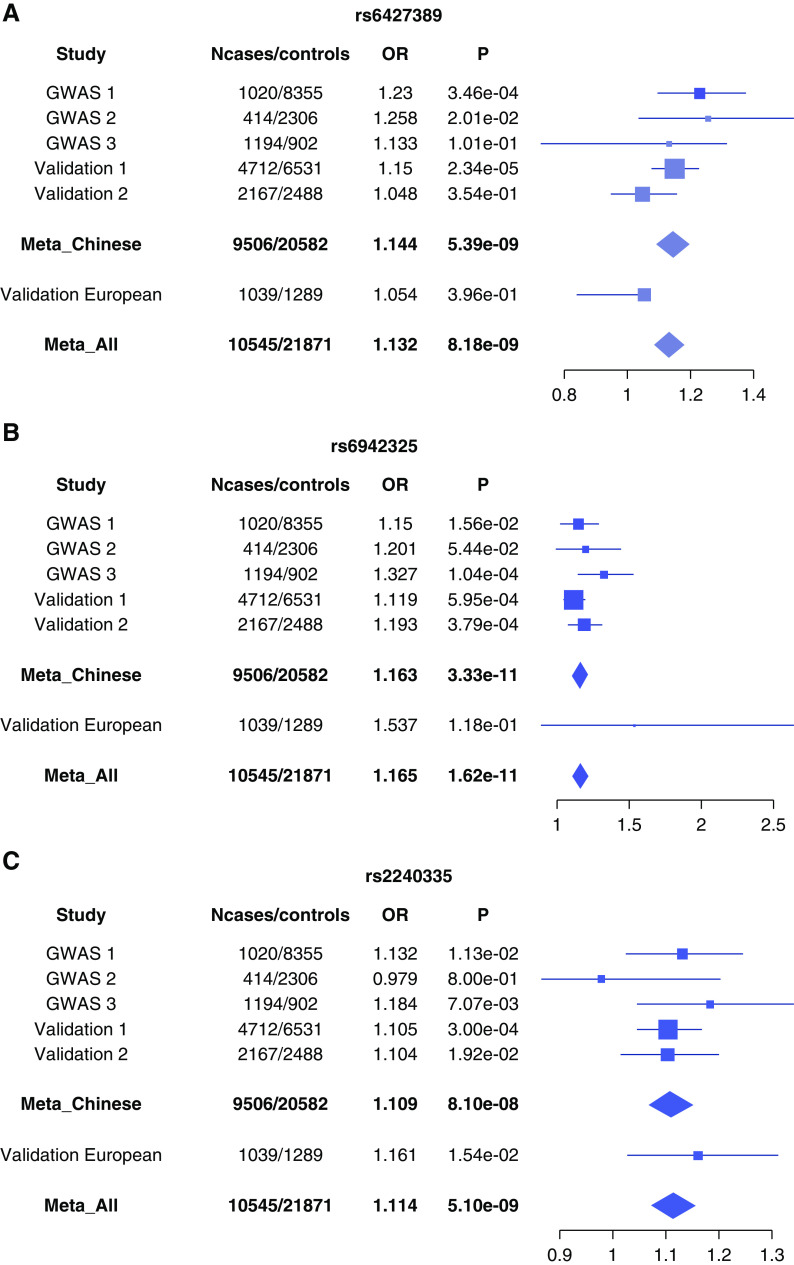
Figure 3.
The forest plots of three novel loci across the three discovery and two validation samples. (A) rs6427389 at 1q23.1 (FCRL3); (B) rs6942325 at 6p25.3 (DUSP22, IRF4); and (C) rs2240335 at 1p36.13 (PADI4). Shown are the associations in the discovery stage (across Northern Chinese samples, Southern Chinese samples, and the Chinese samples in Gharavi et al.’s study15,16), and the validation stage (Northern Chinese, Southern Chinese, and Gharavi et al.’s Italian population [Europeans]16). On the left, each study is indicated. The plots show the study-specific association estimates (ORs) and 95% confidence intervals for the discovery and validation stage studies, presented as bars. GWAS 1, Northern Chinese samples; GWAS 2, Southern Chinese samples; GWAS 3, Chinese samples in Gharavi et al.’s study; validation 1, Northern Chinese; validation 2, Southern Chinese; validation European, Gharavi et al.’s Italian population.

