
Figure 2.
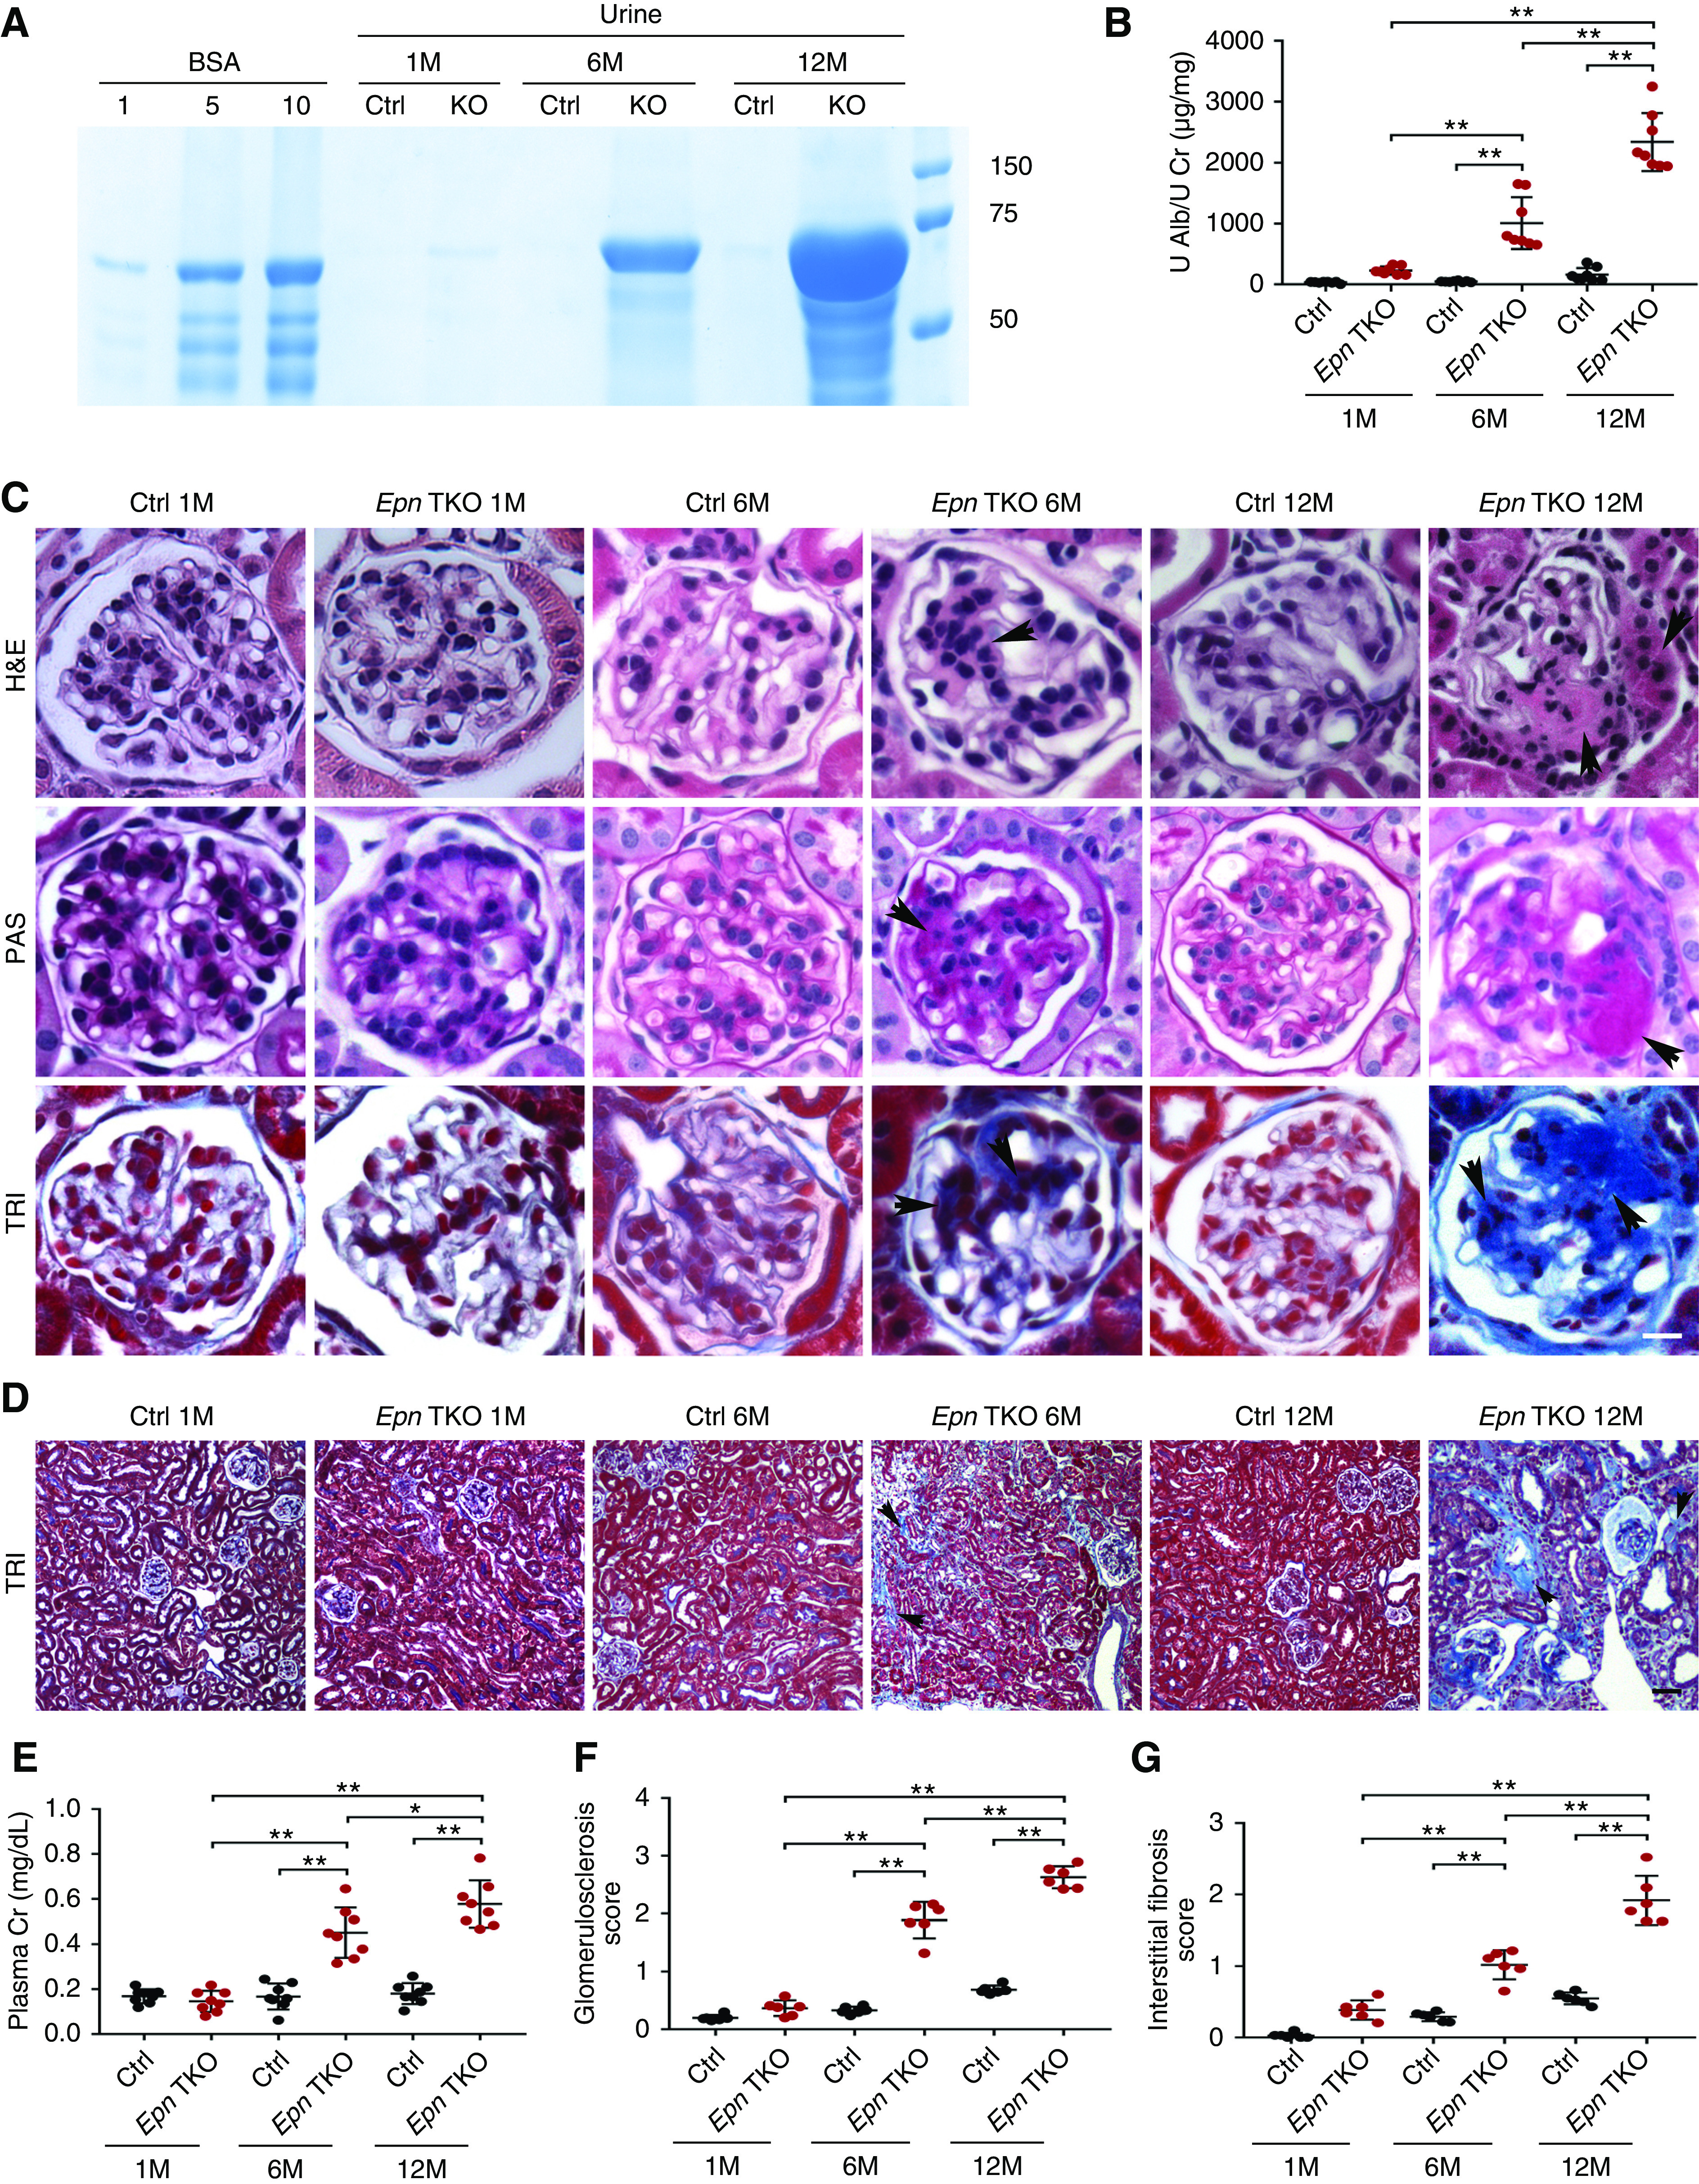
Pod-Epn TKO mice demonstrate albuminuria, glomerulosclerosis, and kidney failure. (A) SDS-PAGE (Coomassie blue staining) of standard BSA (numbers indicate μg) and urine from control and Pod-Epn TKO mice at 1, 6, and 12 months of age. (B) Quantification of urine albumin normalized to creatinine in control (black) and Pod-Epn TKO mice (red) at 1, 6, and 12 months of age. n=8. **P<0.01. (C) Representative light microscopic images (hematoxylin and eosin [H&E], PAS, and TRI) of a single glomerulus from control and Pod-Epn TKO mice at 1, 6, and 12 months of age. Arrowheads show mesangial matrix accumulation in H&E and PAS stain, and glomerulosclerosis in TRI stain. Scale bar, 10 μm. (D) Representative TRI-staining images of kidney interstitium from control and Pod-Epn TKO mice at 1, 6, and 12 months of age. Arrowheads display interstitial fibrosis. Scale bar, 50 μm. (E) Plasma creatinine in control (black) and Pod-Epn TKO (red) mice at 1, 6, and 12 months of age. n=8. (F) Quantification of glomerulosclerosis in (C). n=6 different mice. (G) Quantification of interstitial fibrosis in (D). n=6 different mice. **P<0.01. Alb, albumin; Cr, urinary creatinine; Ctrl, control; U, urinary.