Figure 3.

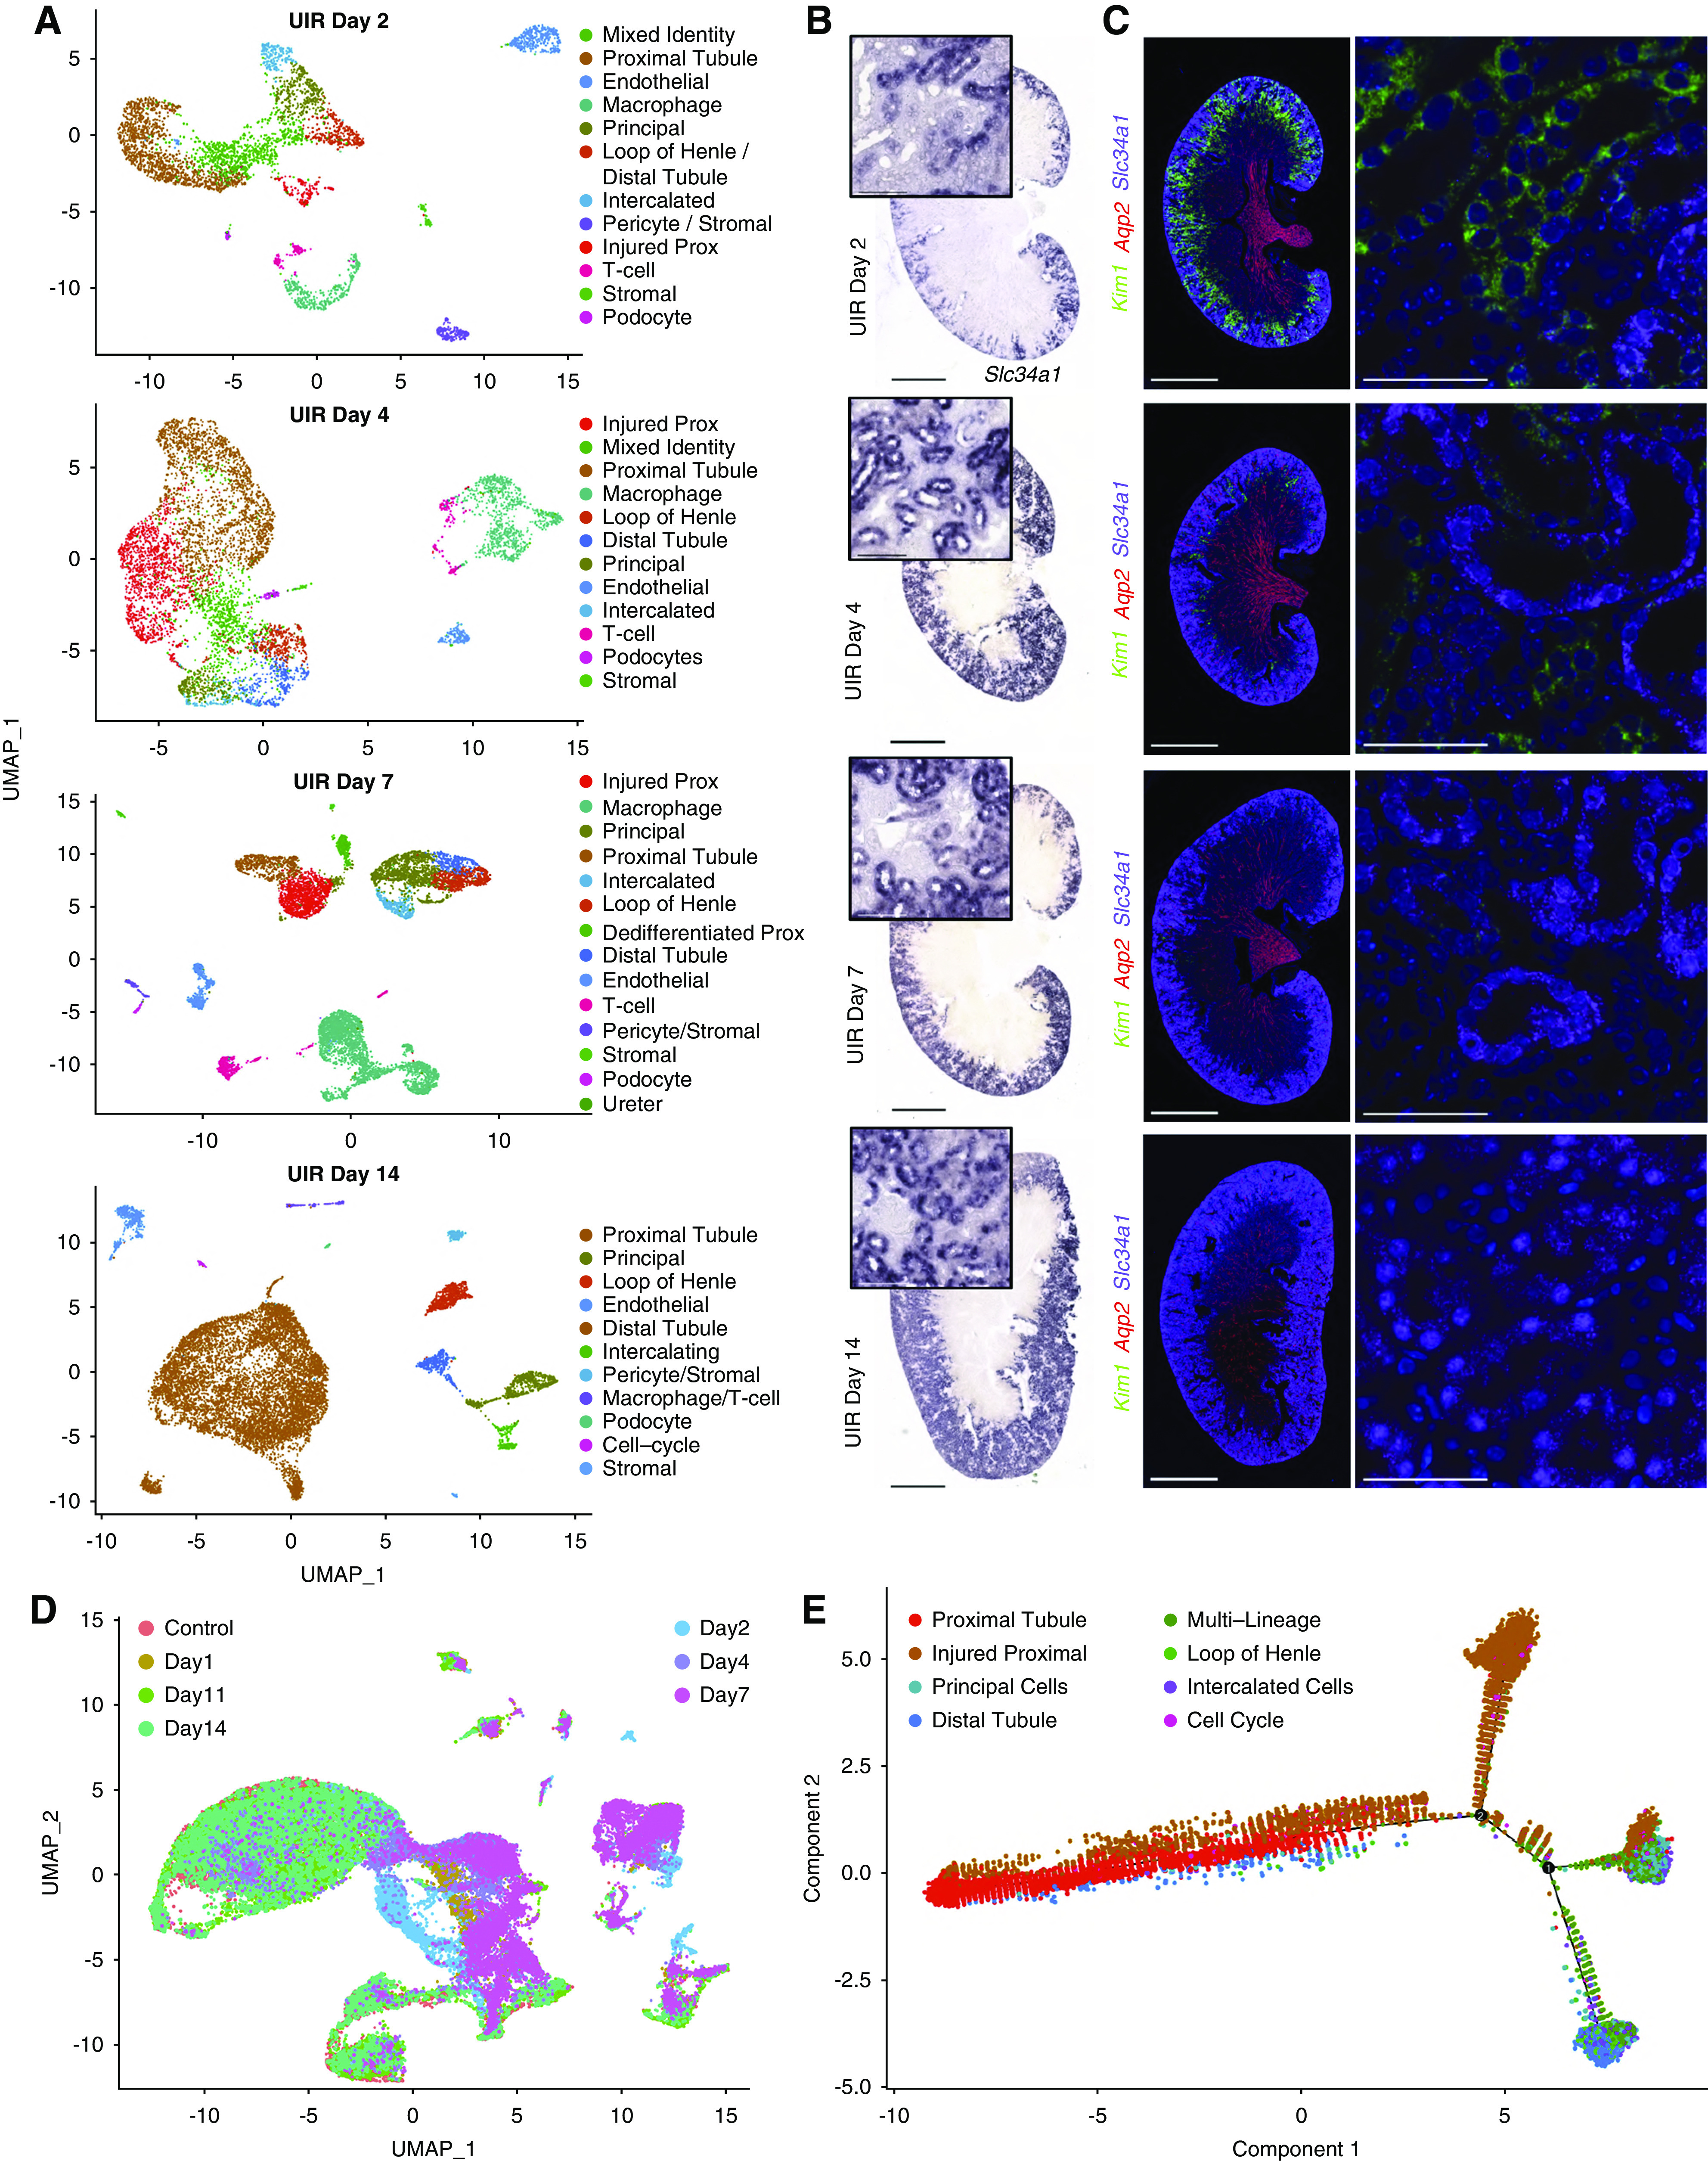
scRNA-seq reveals the transcriptional landscapes of AKI recovery. (A) UMAPs show renal cell populations in the UIR day 2, 4, 7, and 14. Day 11 is shown in Supplemental Figure 3, because it was very similar to day 14. (B) Slc34a1 CISH, UIR day 2, 4, 7, and 14. Slc34a1, a marker of differentiated proximal tubules, showed continued, severely reduced, expression at day 2, which steadily recovered by day 14. Original magnification, ×4; zoom into the cortex, ×40. (C) Kim1 (green), Aqp2 (red), Slc34a1 (purple), DAPI (blue) RNAscope, UIR day 2, 4, 7, and 14. The injury marker Kim1 showed strong expression at day 2, less expression at day 4, and very little expression at day 7, which returned to normal levels by day 14. Original magnification, ×4, zoom into the cortex, ×60. (D) UMAP shows the integrated, all-time-point analysis of change in renal cell populations over the AKI course. Note the colocalization of renal cell populations from UIR day 1 and 2, outlining the most prominent injury, and UIR day 11 and 14, which reflect AKI recovery and also colocalize with the control. Renal cell populations from the intermediate stages (UIR day 4 and 7) are localized between the “injured” and “recovered” groups. (E) Trajectory analysis of the control, UIR day 1, 4, 7, and 14 renal cell populations shows the transition from injured to recovered renal tubules. Numbers 1 and 2 represent the significant branch points of differentiation. Scale, ×4, 2500 μm; ×40, 100 μm; ×60, 25 μm. Related to Supplemental Figures 5–8 and Supplemental Tables 4 and 5.
