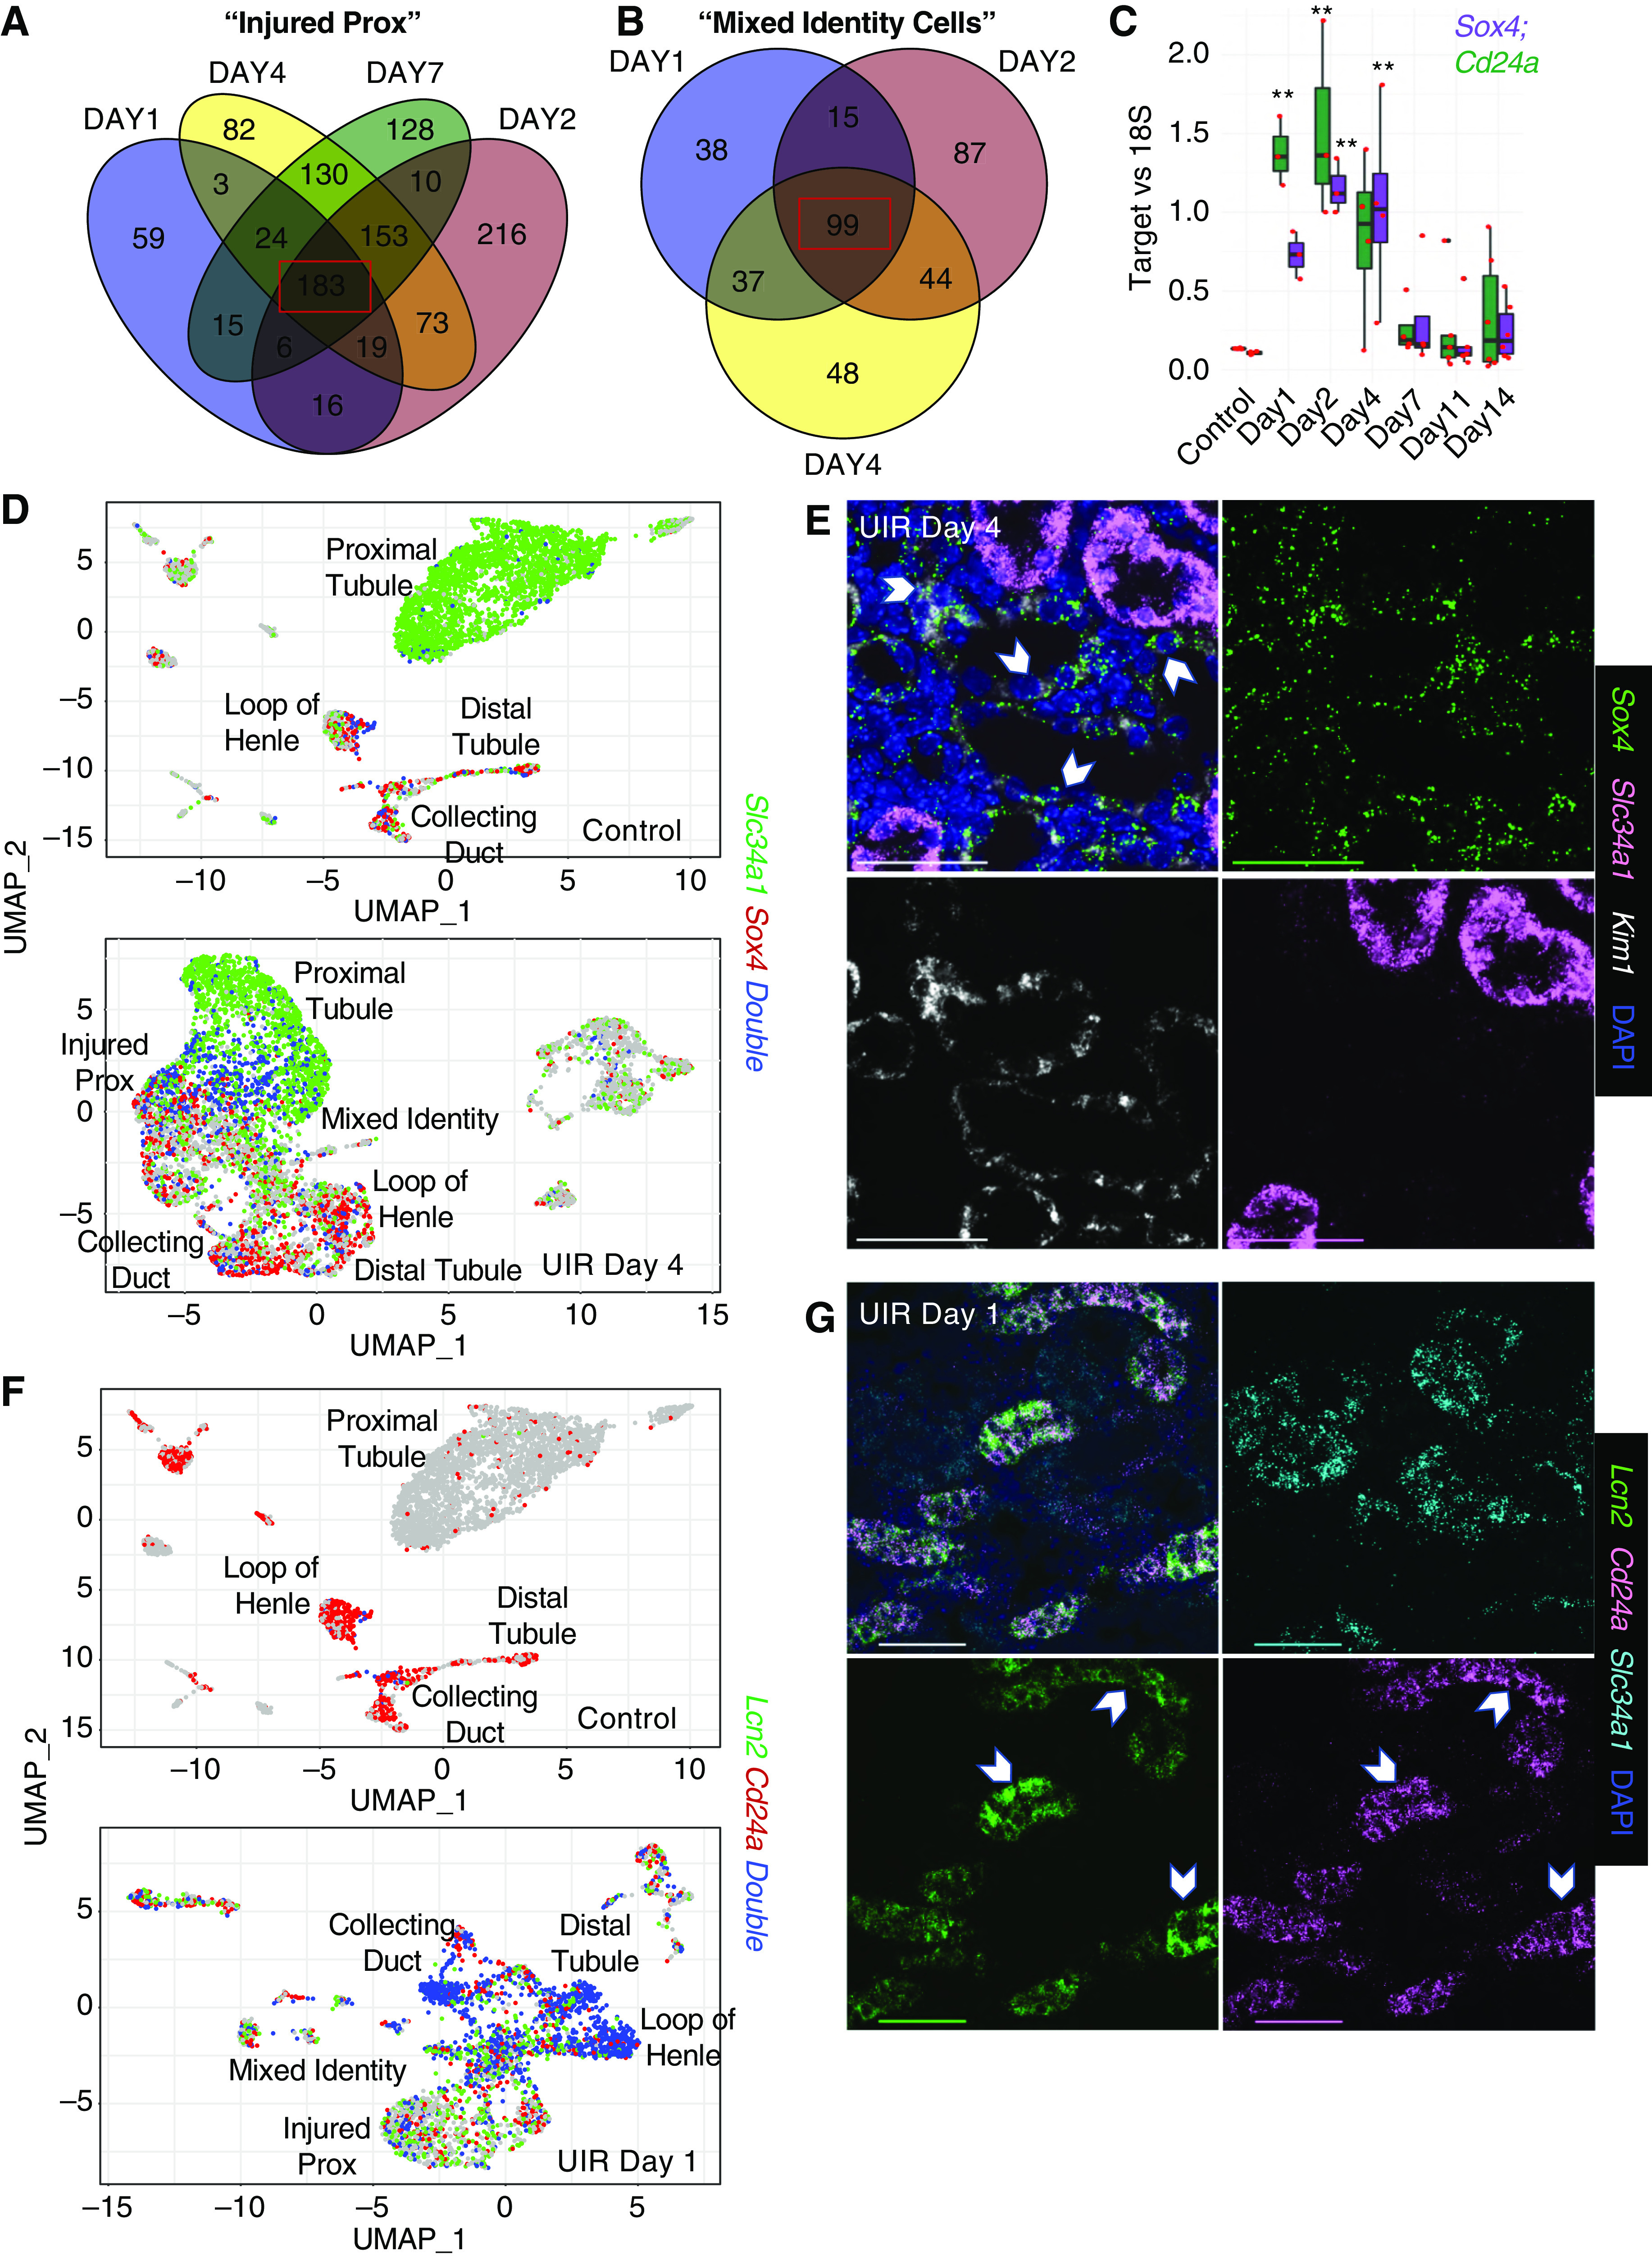
Figure 4.

Sox4 and Cd24a label the proximal and distal tubule injury. (A) Venn diagram shows the genes elevated in the injured prox at UIR day 1, 2, 4, and 7. Injured proximal tubule gene expression patterns were compared with control proximal tubule. Note 183 overlapping genes highlighted by the red box. (B) Venn diagram shows the genes elevated in the mixed-identity cells at UIR day 1, 2, and 4. Mixed-identity cell gene expression patterns were compared with control proximal tubule. A total of 99 genes overlapping between the time points are highlighted by the red box. (C) qPCR shows Sox4 and Cd24a expression over the AKI course. These nephrogenic genes showed significant elevation at days 1, 2, and 4. n=4–6 animals per group, analyzed with one-way ANOVA with Bonferroni correction. **P<0.01 compared with control. Scale, ×4, 2500 μm; ×40, 100 μm; ×60, 25 μm. (D) Feature plots show cells expressing Slc34a1 (green), Sox4 (red), and both (blue) in UIR day 4 versus control. In the control, very few proximal tubule cells expressed Sox4 (many with Slc34a1, blue dots). In UIR day 4, Sox4 was predominantly expressed by injured proximal tubules, showing an inverse relationship with Slc34a1. (E) RNAscope with Slc34a1 (pink), Sox4 (green), and Kim1 (white) probes, and DAPI (blue) in the UIR day 4. In the cortical region of the UIR day 4 kidney, the dedifferentiated proximal tubules, with reduced Slc34a1 expression, showed robust expression of Kim1 and Sox4. Original magnification, ×60, 0.14 μm/px Nyquist zoom, maximal intensity projection from Z-stack; scale, 50 μm. (F) Feature plots show Lcn2 (green), Cd24a (red), and Double (blue) positive cells in UIR day 1 versus control. Whereas Lcn2 and Cd24a showed very weak expression in the control kidney, UIR day 1 showed striking colocalization between Lcn2 and Cd24a in the distal tubule, loop of Henle, and collecting duct. Cd24a was also elevated in the injured proximal tubules and mixed-identity cells. The feature plots show gene expression without color gradient outlining the expression level. (G) RNAscope images show Lcn2 (green) and Cd24a (pink) colocalization at UIR day 1, white pointers. Cd24a is also elevated in Slc34a1-positive (cyan) proximal tubules. DAPI, blue. Original magnification, ×60, 0.21 μm/px Nyquist zoom, maximal intensity projection (MaxIP) from Z-stack; scale, 50 μm. Related to Supplemental Figures 9–12 and Supplemental Table 6.
