Figure 5.

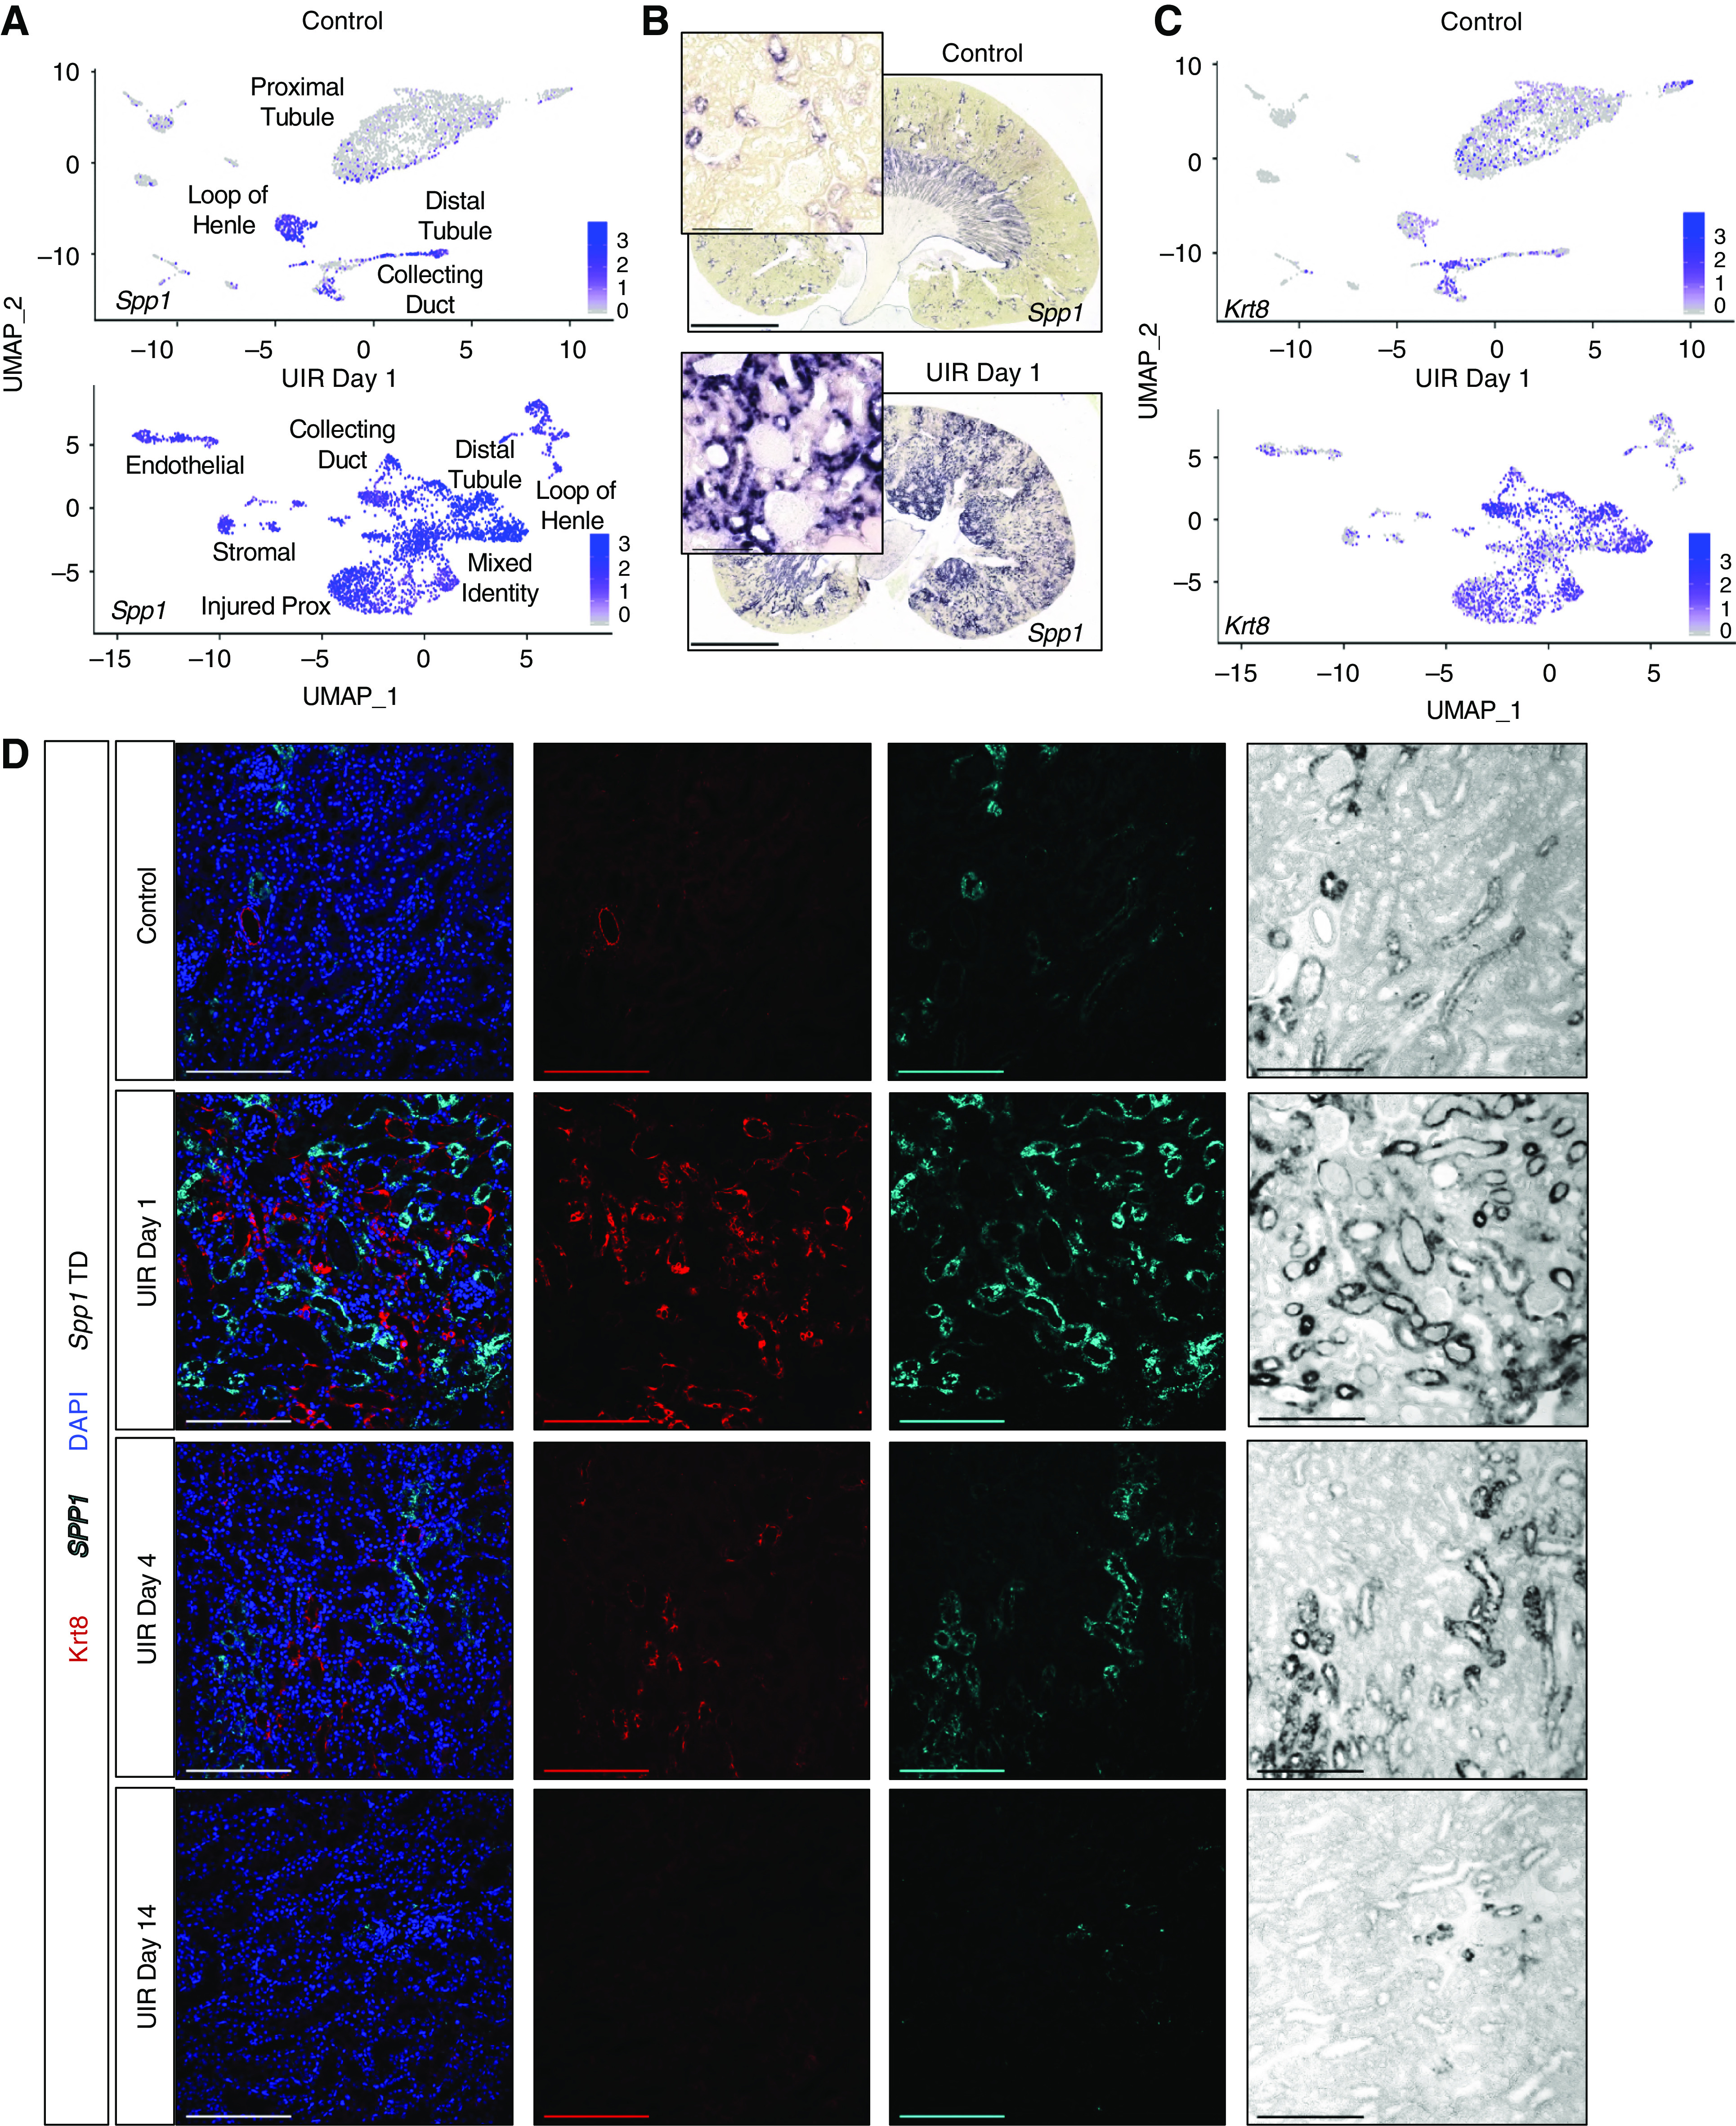
AKI causes extensive Osteopontin and Keratin signaling in the injured kidney. (A) Feature plots show Spp1 expression in control and UIR day 1 cell populations. Color gradient outlines the expression intensity. (B) Spp1 CISH, control versus UIR day 1. Original magnification, ×4; zoom into the cortex, ×40. Scale, 100 μm. (C) Feature plots show Krt8 expression in control and UIR day 1 cell populations. Color gradient outlines the expression intensity. (D) Combined Spp1 CISH (cyan) and Krt8 Immunofluorescence (red) shows the injury-induced Spp1 and Krt8 elevation in UIR day 1 and 4, resolving by UIR day 14. scRNA-seq-predicted Krt8 elevation is reproduced on the protein level. DAPI (blue), UIR day 1. Original magnification, ×20. Scale, 200 μm. TD, transmitted detector shows the chromogenic Spp1 CISH signal. Related to Supplemental Figure 13.
