Figure 6.

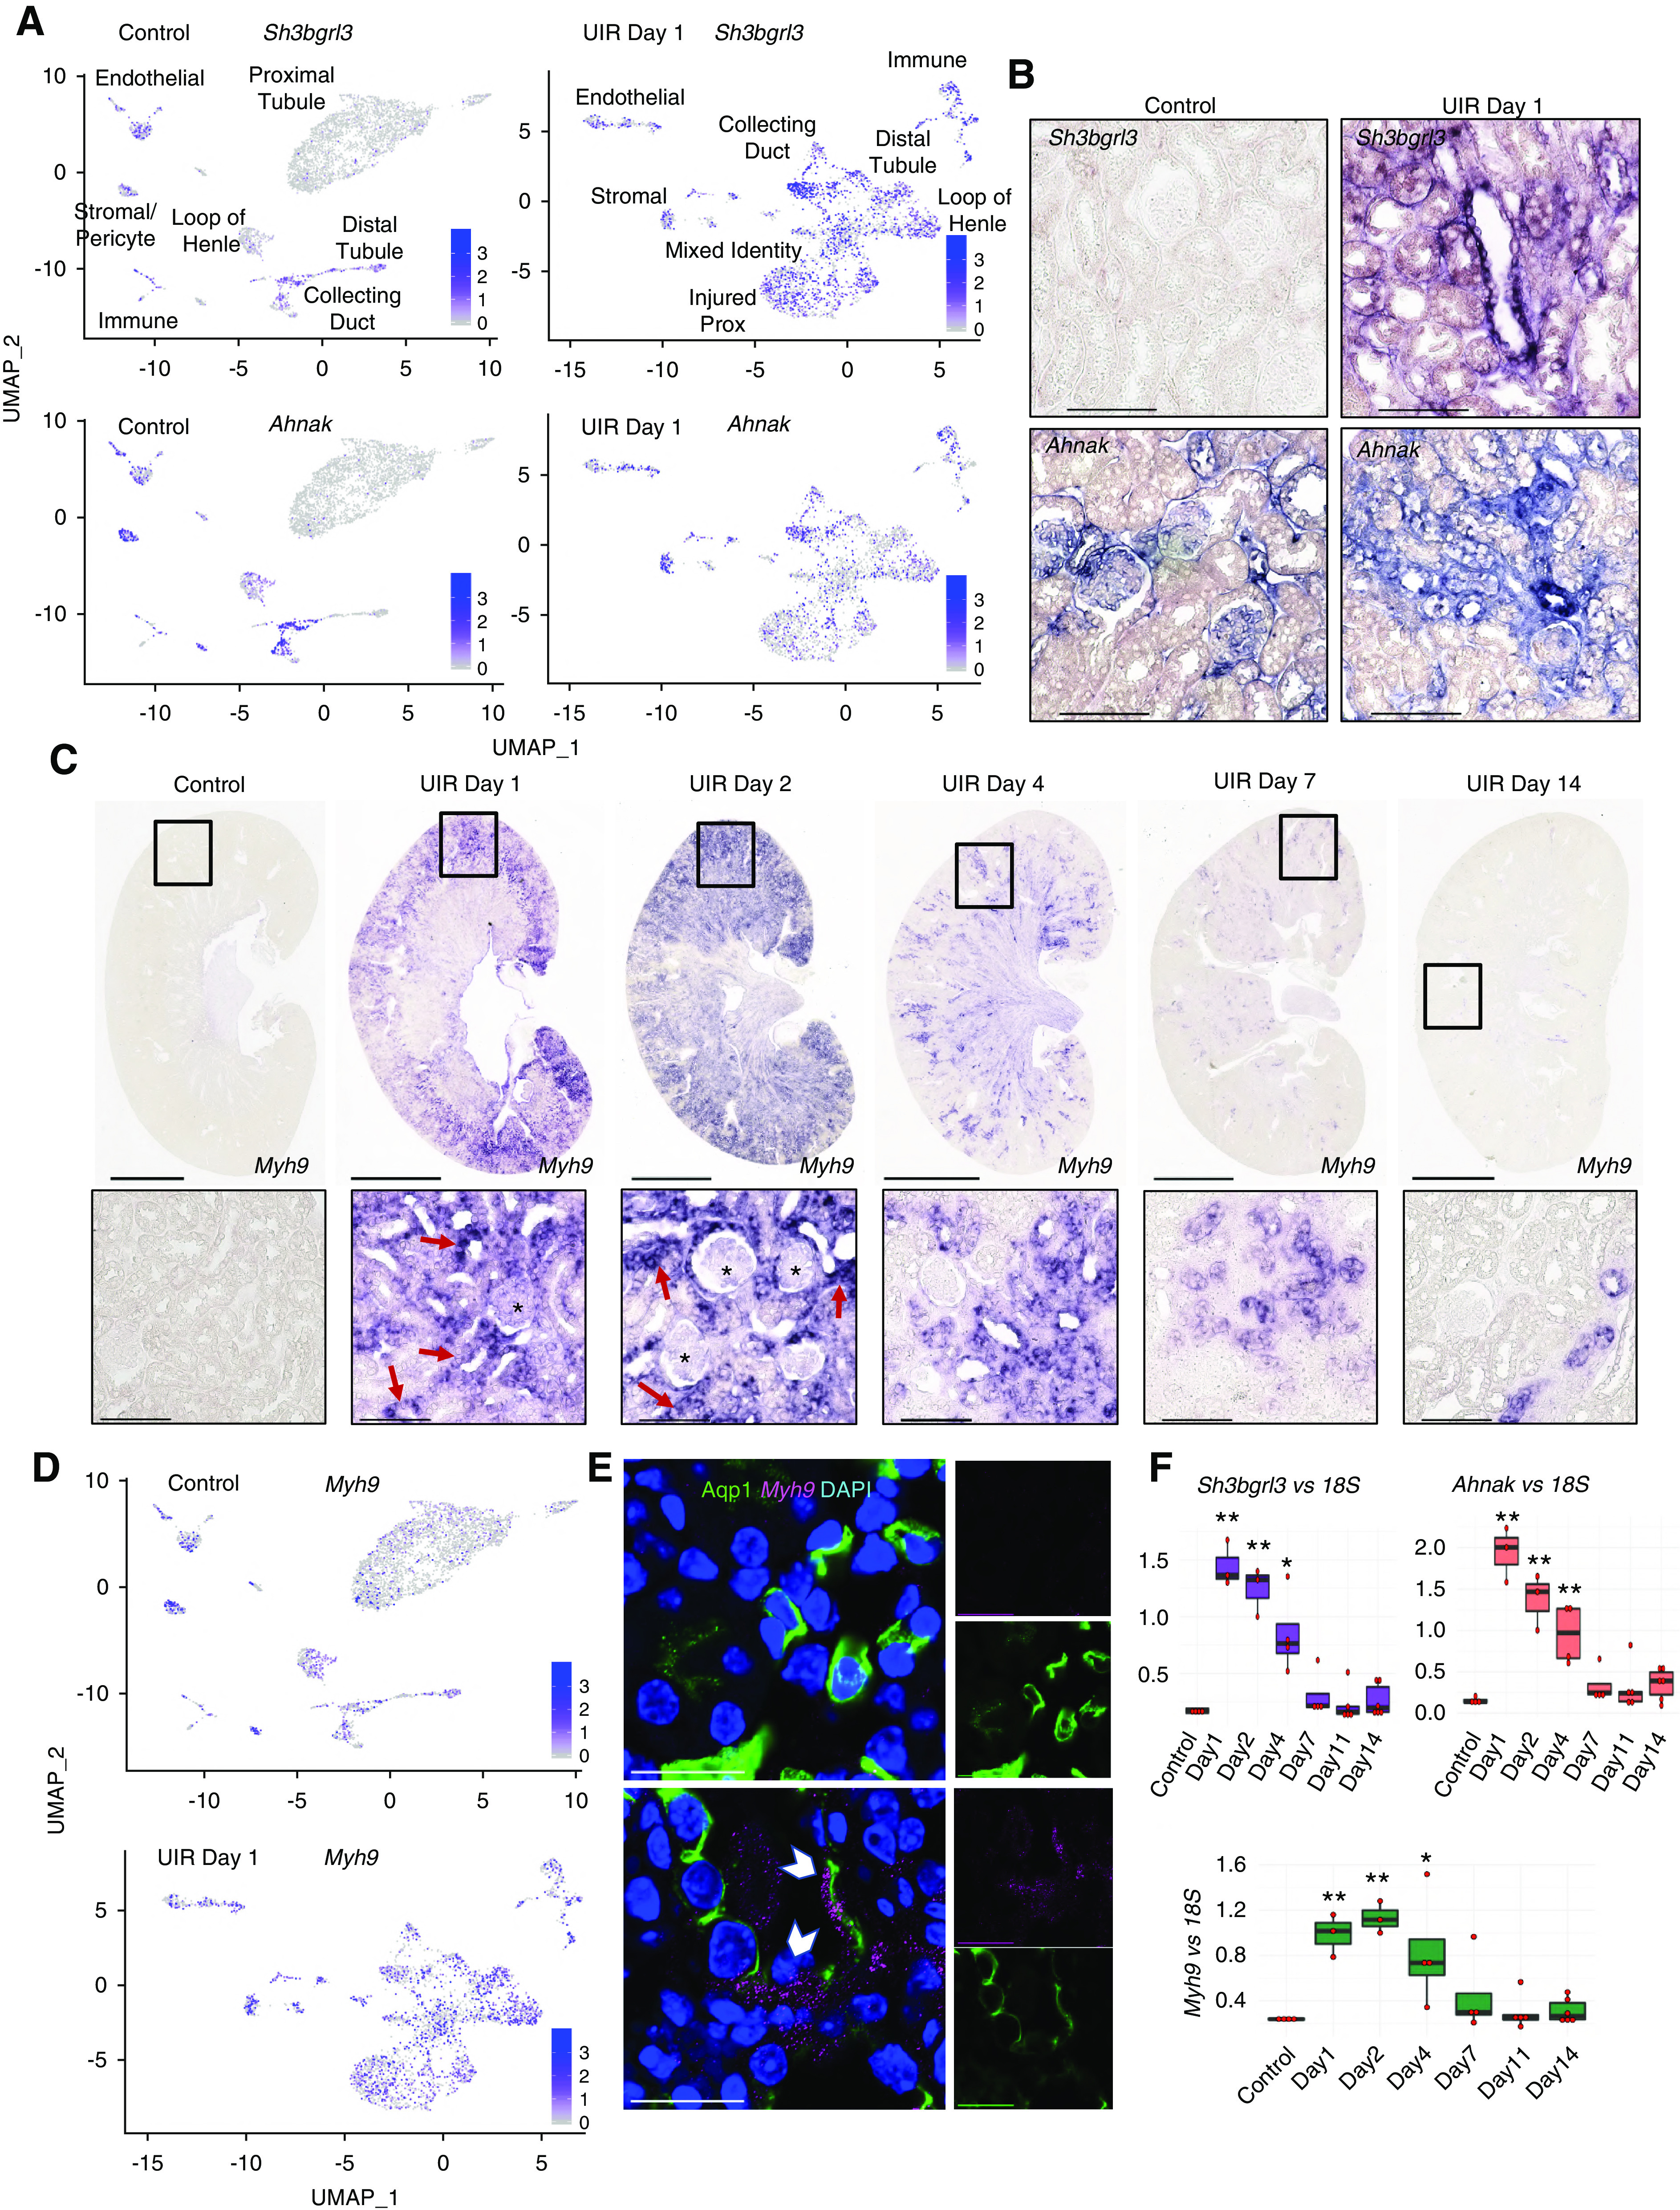
scRNA-seq reveals novel gene expression signatures of AKI. (A) Feature plots show Sh3bgrl3 and Ahnak expression in UIR day 1 versus control. Note that although both genes are nearly absent in the control proximal tubules and moderately expressed in the control collecting duct, AKI induces their robust elevation in multiple tubular segments. (B) Sh3bgrl3 and Ahnak CISH, UIR day 1 versus control. Note that Ahnak, which is normally expressed mostly in the glomeruli and stroma, is substantially elevated in the injured renal tubules. Original magnification, zoom into the cortex, ×40. Scale, 100 μm. (C) Myh9 CISH shows robust elevation in UIR day 1 and 2, which steadily declines at day 4 and 7, with reversal to the normal levels by day 14. Note the intratubular (red arrows) and glomerular (black stars) Myh9 expression induced by AKI. Original magnification, ×4; scale, 2500 μm. Zoom into the cortex (black frames), ×40; scale, 100 μm. (D) Feature plots show Myh9 expression in UIR day 1 versus control. Note the elevation in all tubular segments. (E) Myh9 CISH (magenta), Aqp1 IF (green), DAPI (blue), control versus UIR day 1. White pointers show Myh9 within Aqp1-positive tubules. Original magnification, 60× Nyquist 0.07 px/μm zoom, scale 25 μm. (F) qPCR shows Myh9, Sh3bgrl3, and Ahnak expression over AKI course, four to six animals per group, one-way ANOVA with Bonferroni and Holm. *P<0.05, **P<0.01 compared with the control. Related to Supplemental Figure 13.
