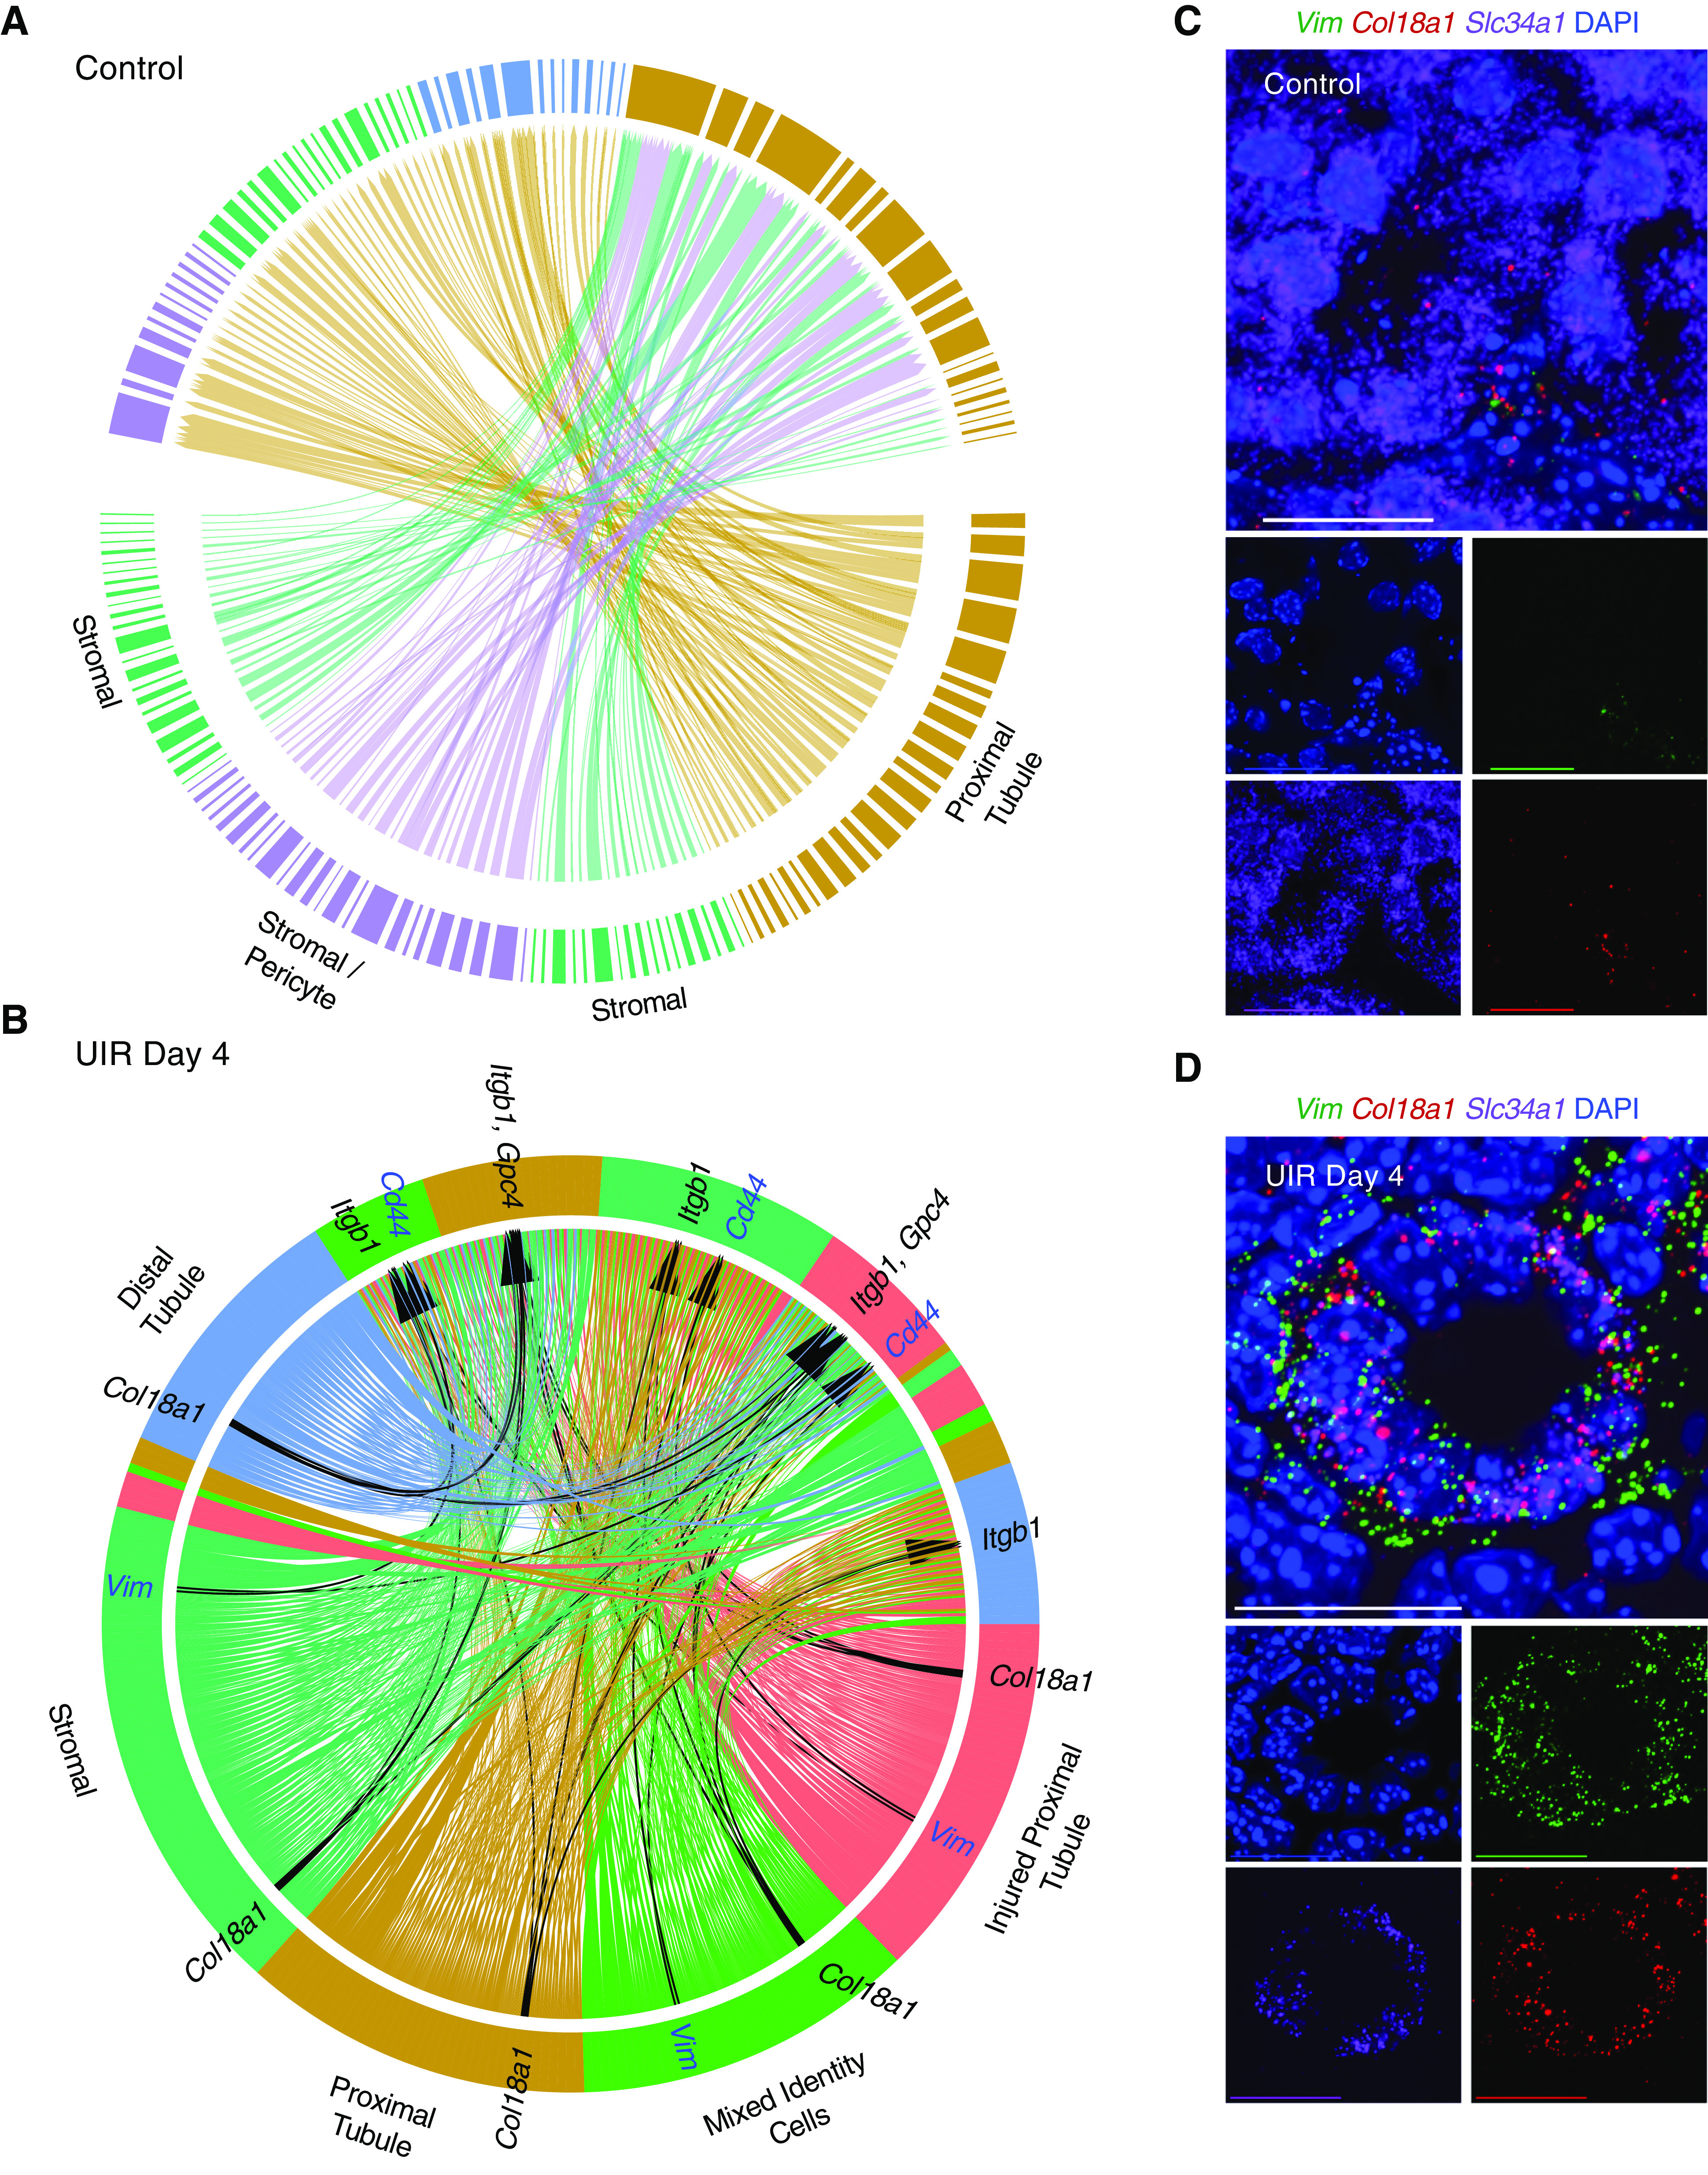
Figure 7.

scRNA-seq identifies novel epithelial-to-stromal interactions in adult AKI. (A) Circos plot of ligand-receptor interactions between the proximal (brown) and distal (blue) tubules, the stromal cells (green), and the stromal/pericyte cells (purple) in the normal kidney. The populations producing the putative ligand are labeled; directions of predicted ligand-receptor interactions are shown with the sharp ends of the arrows. The names of all putative ligands and receptors with respect to the cell populations are available in Supplemental Figure 14 and Supplemental Table 7. (B) Circos plot of ligand-receptor interactions between the proximal tubules (brown), injured proximal tubules (red), mixed-identity cells (green), distal tubules (blue), and the stromal cells (teal) in the UIR day 4 kidney. The populations producing the putative ligand are labeled; black arrows show Vim-Cd44 (highlighted in blue), Col18a1-Gpc4, and Col18a1-Itgb1 (highlighted in black) ligand-receptor pairs. Note the dramatic increase in the number of potential interactions compared with the control, using the same filters. The names of all putative ligands and receptors with respect to the cell populations are available in Supplemental Figure 15 and Supplemental Table 7. (C) Representative RNAscope image of control proximal tubules, Vim (green), Col18a1 (red), Slc34a1 (purple). Original magnification, 60×, 0.05 μm/px Nyquist zoom, maximal intensity projection from the Z-stack. Scale, 25 μm. (D) Representative RNAscope image of UIR day 4 proximal tubule, Vim (green), Col18a1 (red), and Slc34a1 (purple). Note the elevated Vim and Col18a1 inside the proximal tubule exhibiting lowered Slc34a1 level. Original magnification, 60×, 0.05 μm/px Nyquist zoom, maximal intensity projection from the Z-stack. Scale, 25 μm. Related to Supplemental Figures 13–15, Supplemental Videos 1 and 2, and Supplemental Table 7.
