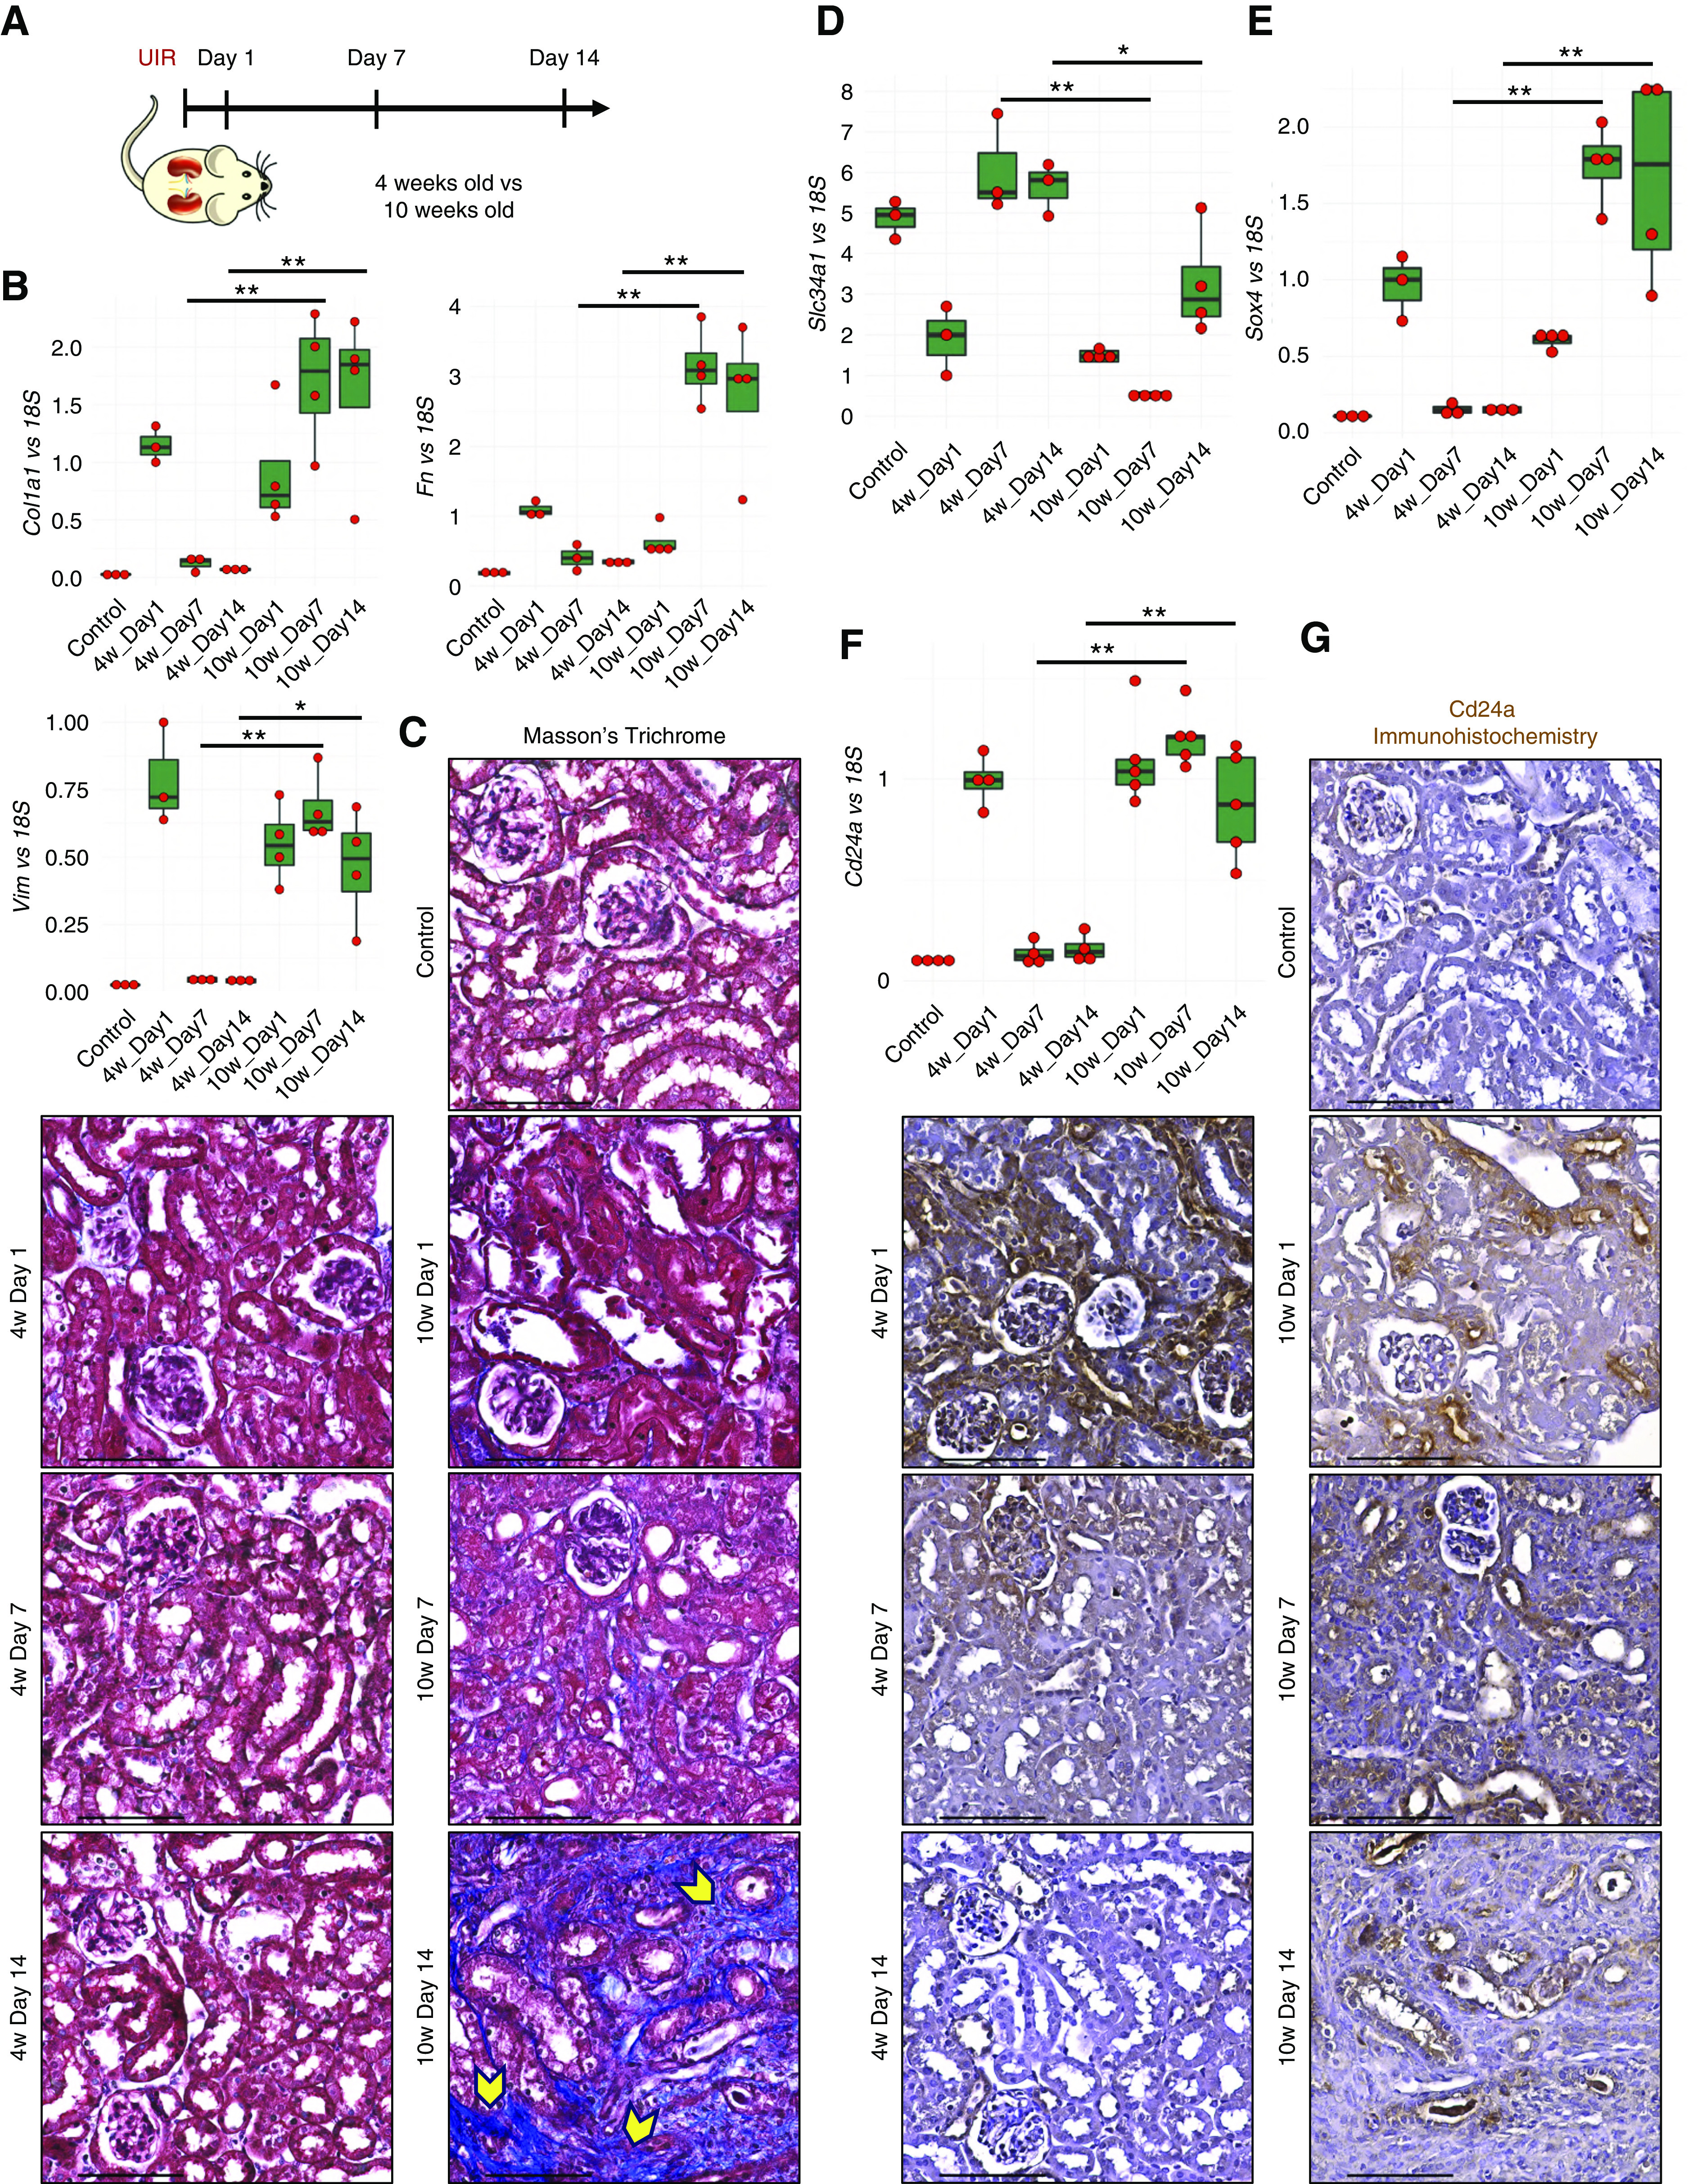
Figure 8.

Increasing onset age exacerbates AKI outcome. (A) Experimental outline. (B) qPCR shows the fibrosis markers Vim, Col1a1, and Fn1 expression over the AKI course, n=4–6 per group, t test, 4 weeks day 7 versus 10 weeks day 7, 4 weeks day 14 versus 10 weeks day 14. *P<0.05, **P<0.01. (C) Masson trichrome staining shows fibrotic remodeling in the 10-week-old mice at UIR day 14. Note the abundant fibrotic remodeling (blue color on the Masson trichrome staining, yellow pointers) in the UIR day 14 of older mice, while UIR day 14 younger mice exhibit normal kidney histology. Original magnification, ×40. Scale, 100 μm. (D–F) qPCR shows Slc34a1, Sox4, and Cd24a expression over the AKI course, n=4–6 per group, t test, day 7, 4 weeks versus 10 weeks; day 14, 4 weeks versus 10 weeks. *P<0.05, **P<0.01. (G) Cd24a IHC. Note persistent intratubular expression in the UIR 10-week-old mice, resolved in the UIR 4-week-old mice. Original magnification, zoom into the cortex, 40×. Scale, 100 μm. (A) The kidney image is reprinted from ref. 120, with permission from Elsevier.
