
Fig 2. Correlations between observed and predicted probabilities across the task.
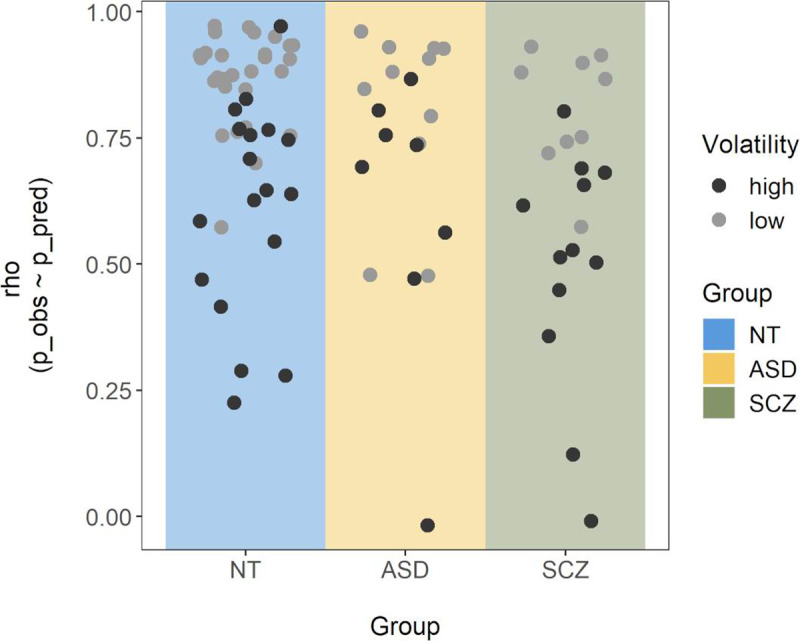
For each participant, a Spearman correlation was calculated between the participant’s subjective probability ratings and those predicted by the volatility model with the best fitting volatility parameter. Single points represent the corresponding correlation coefficient (ρ) for each participant and are colored by size of the corresponding volatility estimate (with clusters of high and low volatility based on a bimodality analysis reported in the results section).