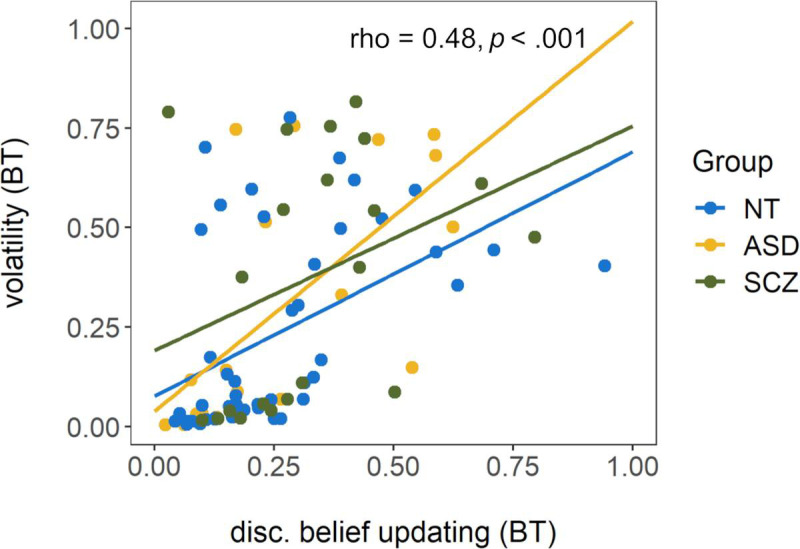
Fig 5. Scatterplot of disconfirmatory belief updating (untransformed) and estimated volatility from the beads task (BT).

Rho and p display the results of a Spearman correlation conducted across the total sample. Regression lines are fitted for each group for illustrative purposes only. NT = neurotypically developing individuals, ASD = individuals with autism spectrum disorder, SCZ = individuals with schizophrenia.
