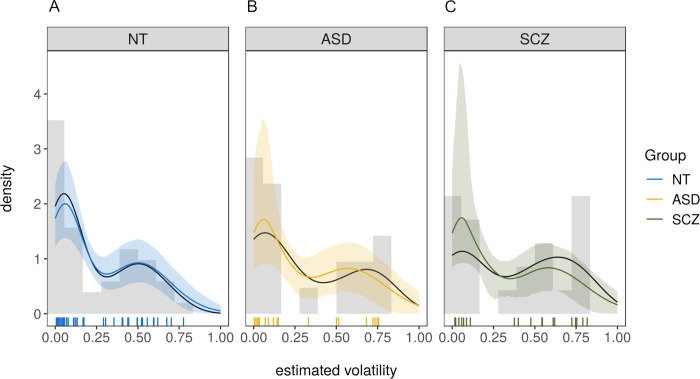
Fig 6. Posterior-predictive distributions of the winning model for all three groups.
(A) for neurotypically developing individuals (NT), (B) for individuals with autism spectrum disorder (ASD), (C) for individuals with schizophrenia (SCZ). Colored lines are posterior means of the posterior predictive distributions, shaded areas are the 5% and the 95% percentile. Black lines are the actual data. Vertical lines are the estimated volatility values for each participant based on the Bayesian volatility model as described in section ‘Measures: Beads task’. NT = neurotypically developing individuals, ASD = individuals with autism spectrum disorder, SCZ = individuals with schizophrenia.

