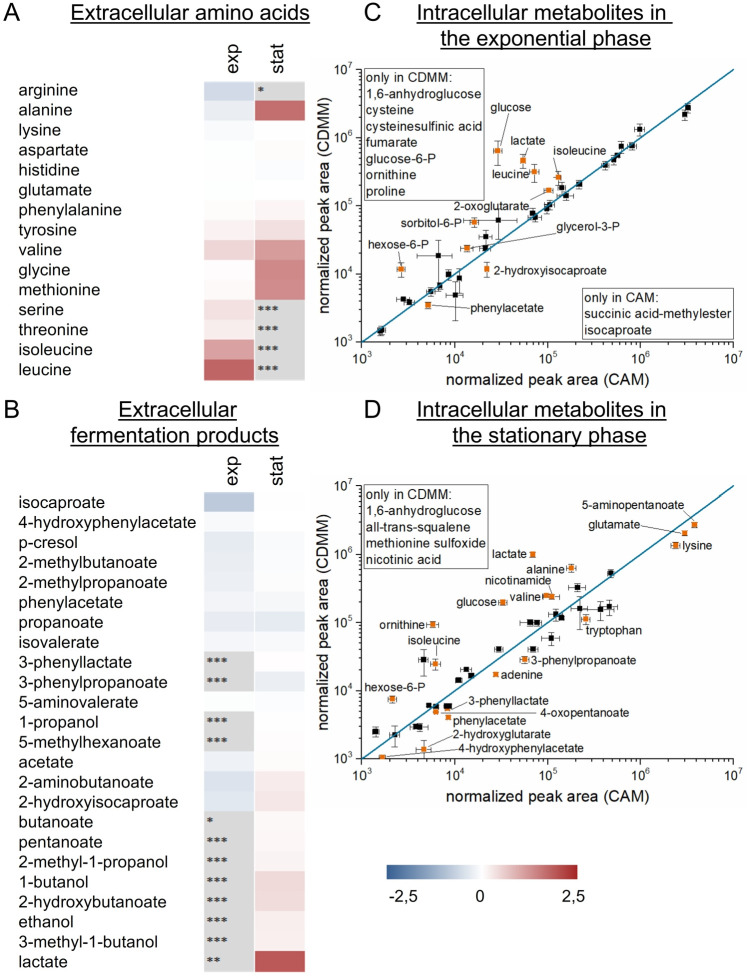
Fig 3. Metabolic data of C. difficile 630Δerm in CAM and CDMM.
Shown are the extracellular metabolites in heatmaps as log2 fold changes of the different amino acids (A) or the fermentation products (B) of the cultivations in CDMM (2 g/L glucose) compared to CAM (no glucose) in the exponential (exp) and the stationary phase (stat). Grey squares indicate not detected metabolites (* not in CDMM, ** not in CAM, *** neither in CDMM nor CAM). The amino acids were analyzed by HPLC-FLD and the fermentation products by GC-MS. The intracellular metabolites were shown as scatterplots from the detected metabolites in the exponential (C) and the stationary phase (D) of cultivations in CAM and CDMM. Known metabolites significantly altered between the two conditions (p-value < 0.05) are labeled in orange. All experiments are based on four independent cultivations.

