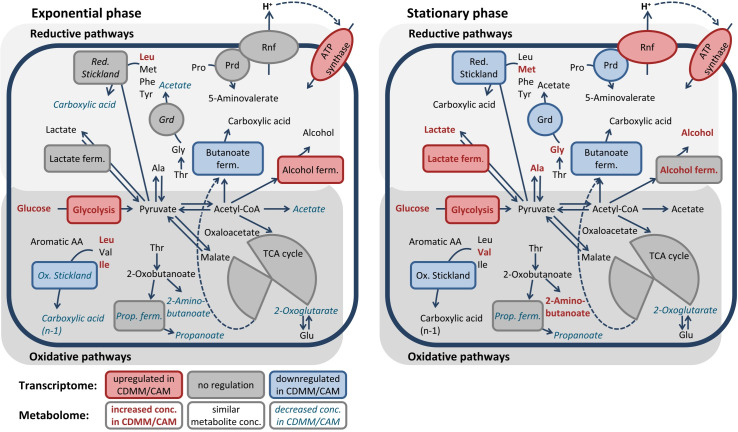
Fig 4. Overview of adaptation of reductive and oxidative pathways in C. difficile by 2 g/L glucose.
Shown are data of transcriptome and metabolome analyses in the exponential (½ ODmax, left side) and stationary phase (ODmax, right side) comparing data from CDMM-cultures (2 g/L Glc) with CAM-cultures (without Glc). Pathway boxes represent the transcriptomic data, generally upregulated pathways are shown in red, while downregulated pathways are blue (-1 > log2 fold change > 1, p-value < 0.05). Metabolomic data are represented by the metabolite names and the pathway names inside the boxes, generally increased concentrations are shown in bold and red, while decreased concentrations are italics and blue (fold change > 1.5). Products of Stickland reactions are carboxylic acids with the same length of the corresponding amino acid in the reductive path and one carbon atom shorter than the corresponding amino acid (n-1) in the oxidative path.

