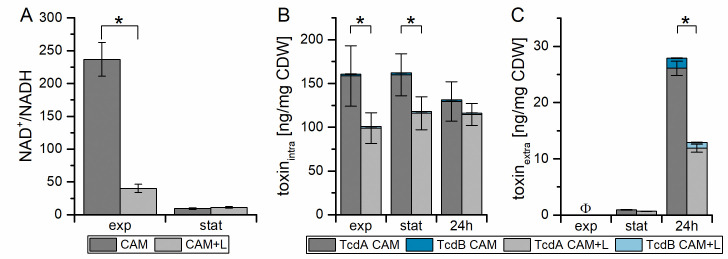
Fig 6. Influence of L-Lactate on NAD+/NADH ratio and intra- and extracellular toxin concentration.
Shown are the NAD+/NADH ratio (A), the intracellular (B) and the secreted (C) toxin A (grey) and B (blue) concentrations in CAM (dark color) and CAM+L (light color). All experiments are based on four independent cultivations. Single values of toxin A and B and of NAD+ and NADH are shown in S5 File. *: significant difference in TcdA concentration between the values of CAM and CAM+L (p-value < 0.05), Φ no toxin detected.

