
Figure 2. Correlation of the paraffin-embedded RNA metric (PERM) with mRNA expression levels in formalin-fixed, paraffin-embedded (FFPE) tissues.
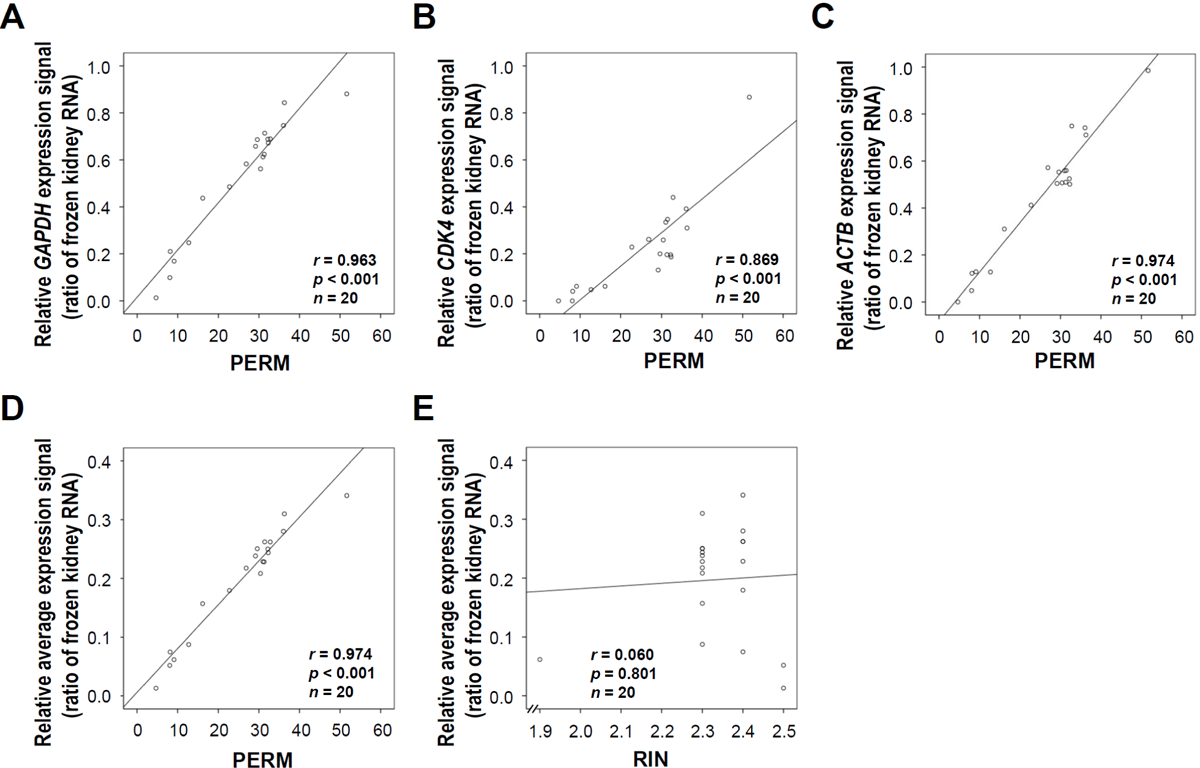
We extracted total RNA from 20 different mouse kidney FFPE tissue specimens. mRNA expression was measured using the QuantiGene assay with mouse GAPDH, CDK4, and ACTB gene-specific probe sets using the QuantiGene reagent system (Panomics). The relative expression level of each gene was normalized to that of frozen kidney tissue. (A) Scatter plot of the PERM versus GAPDH gene expression level (r = 0.963, P < 0.001). (B) Scatter plot of the PERM versus CDK4 gene expression level (r = 0.869, P < 0.001). (C) Scatter plot of the PERM versus ACTB gene expression level (r = 0.974, P < 0.001). (D) Scatter diagram of the PERM versus the average expression levels of the three genes (r = 0.974, P < 0.001). (E) Scatter plot of the RIN versus the average expression levels of the three genes (r = 0.060, P = 0.801). Data represent the mean of three independent experiments.