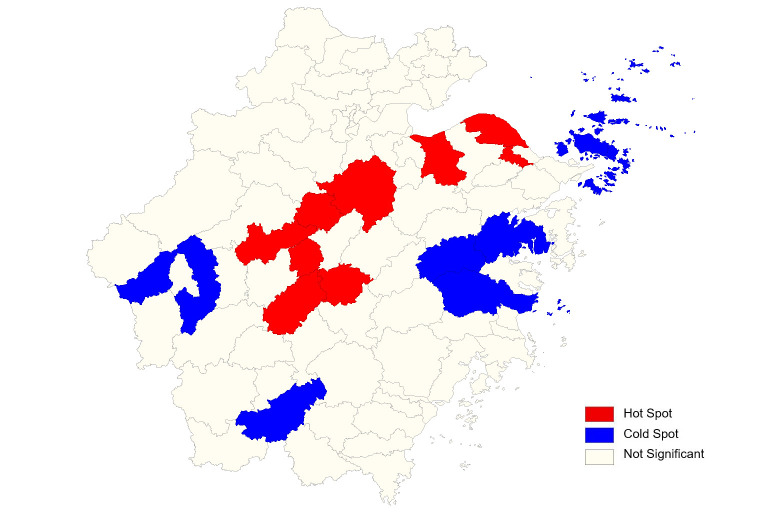
Fig 2. Local spatial autocorrelation analysis of newly detected leprosy cases in Zhejiang Province, 2011–2019.
Different colors represent the types of spatial autocorrelation between different regions. The red represents the statistically significant of high-high positive correlation region, that is, the counties/districts were with a high incidence, and the adjacent counties/districts were also with a high incidence.

