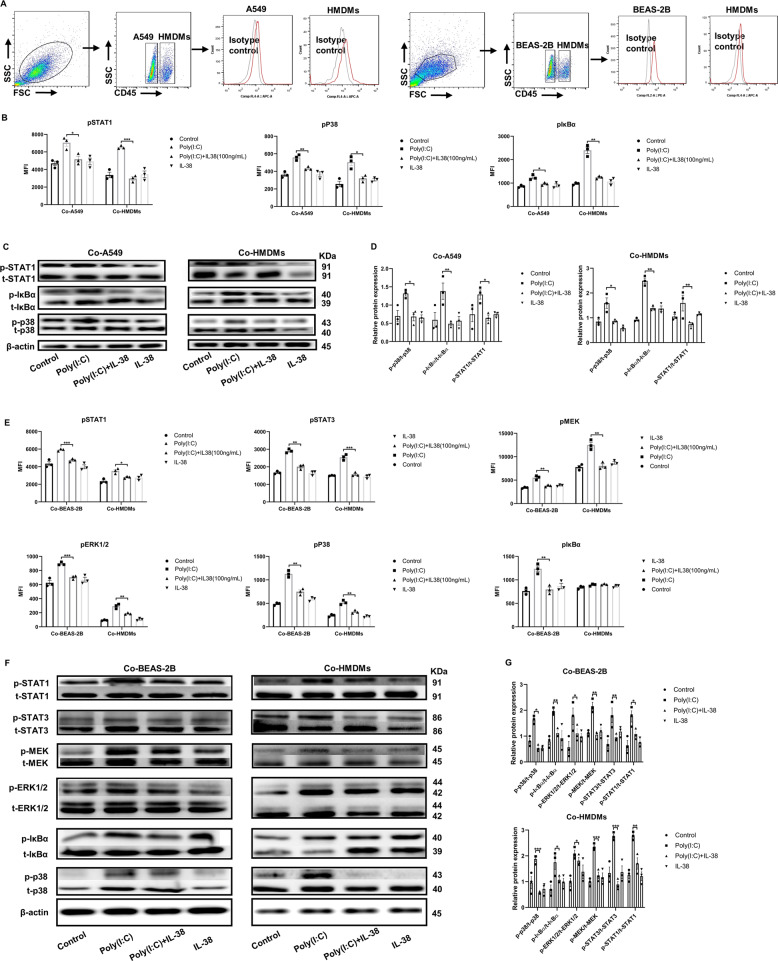
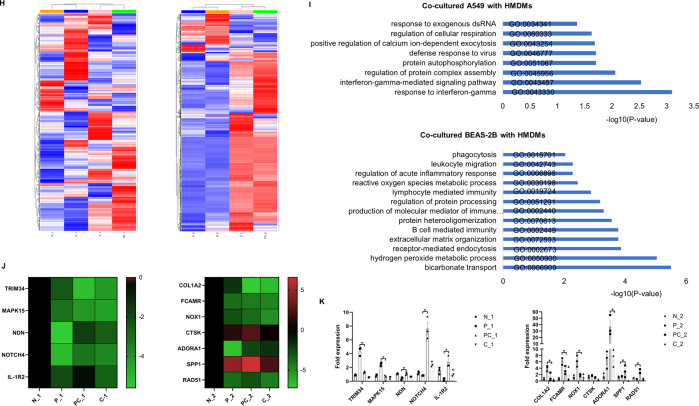
Fig. 2. Targeted intracellular signaling pathways and RNA-seq transcriptional profiling identification of IL-38 target genes in the co-cultures.
A549 cells (1 × 10⁵) or BEAS-2B cells (1 × 10⁵) with HMDMs (3 × 10⁵) were co-cultured with or without rhIL-38 pretreatment for 30 min, followed by poly(I:C) (20 µg/mL) stimulation for 30 min. Heat-inactivated human IL-38 (100 ng/ml) was used as control. (a) Gating strategies for the analysis of signal transducers in the co-cultures. Cells were measured by intracellular staining with specific antibodies, and the absolute MFI values for the phosphorylated signals were used for analysis. A549 cells, BEAS-2B cells, and HMDMs were gated and distinguished based on CD45 expression. (b) Flow cytometric analysis of levels of phosphorylated STAT1, p38, and IκBα on A549 cells (Co-A549) and HMDMs (Co-HMDMs) in the co-cultured A549 cells with HMDMs. (c) Represented electrophoresis strip of phosphorylated and total STAT1, p38, and IκBα on A549 cells (Co-A549) and HMDMs (Co-HMDMs) in the co-cultured A549 cells with HMDMs detected by Western blot analysis. (d) The protein expression of phosphorylated/total STAT1, p38, and IκBα in (c). (e) Levels of phosphorylated STAT1, STAT3, MEK, ERK1/2, p38, and IκBα in BEAS-2B cells (Co-BEAS-2B) and HMDMs (Co-HMDMs) in the co-cultured BEAS-2B cells with HMDMs detected by flow cytometry. (f) Represented electrophoresis strip of phosphorylated and total STAT1, STAT3, p38, ERK1/2, MEK, and IκBα in BEAS-2B cells (Co-BEAS-2B) and HMDMs (Co-HMDMs) in the co-cultured BEAS-2B cells with HMDMs detected by Western blot analysis. (g) The protein-expression of phosphorylated / total STAT1, STAT3, p38, ERK1/2, MEK, and IκBα in (f). (h) Heatmap of the DEGs analyzed by RNA-seq in different groups was shown. (i) Analysis showing selected most significantly downregulated pathways determined by GO functional annotations in terms of biological processes. (j) The fold change for selected differentially expressed genes based on expression level and relative function in lung inflammation, was displayed in a log2-scale heatmap and the corresponding data are shown in Table 2. (K) RT-PCR validation of selected genes indicated in (j). Data are shown as the mean ± SEM. Nonparametric Kruskal-Wallis test followed by Dunn’s multiple comparisons test was used to compare results between groups. *P < 0.05, **P < 0.01, and ***P < 0.001. Abbreviations: DEG, differentially expressed gene; PC, poly(I:C) plus IL-38-treated group; P, poly(I:C)-treated group; N, unstimulated group; and C, IL-38-treated group.


