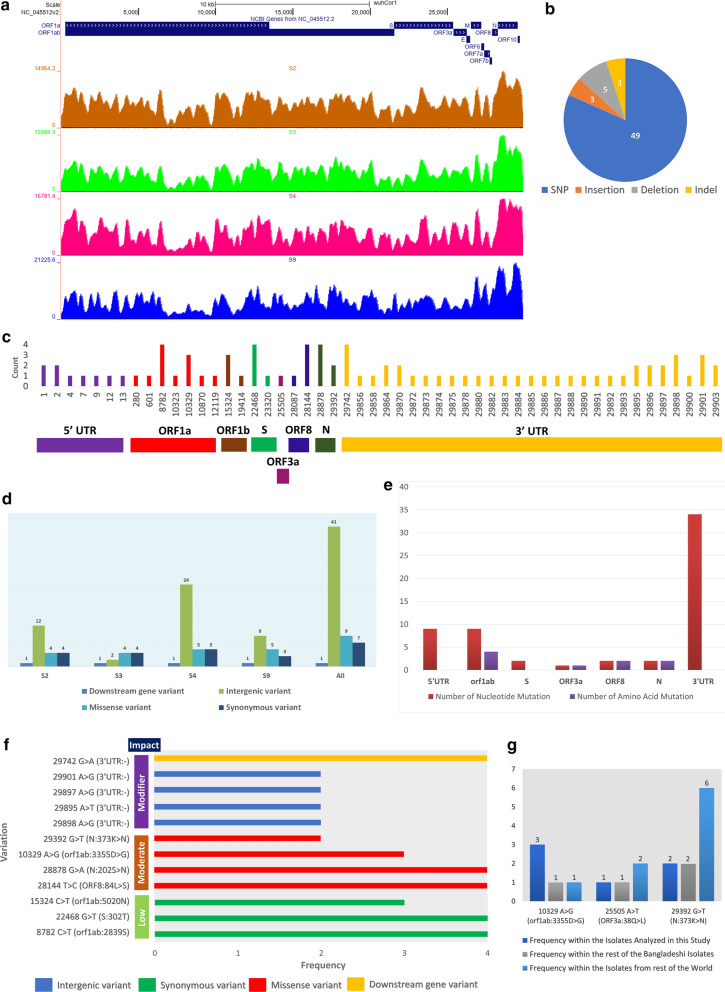
Fig. 2.
Genomic information of the sequenced SARS-CoV-2 isolates. a Genome coverage normalized density map for the four sequenced SARS-CoV-2 isolates. b Pie-chart illustrating the different types of variations found within these four isolates. c Genome location-wise representation of the mutations and their associated frequency. d Isolate-wise variation information. e Gene-wise amount and type of mutations. f Annotated impacts of the different mutations (only those are shown which have frequencies more than 1). g Frequencies of selected unique mutations observed in these isolates

