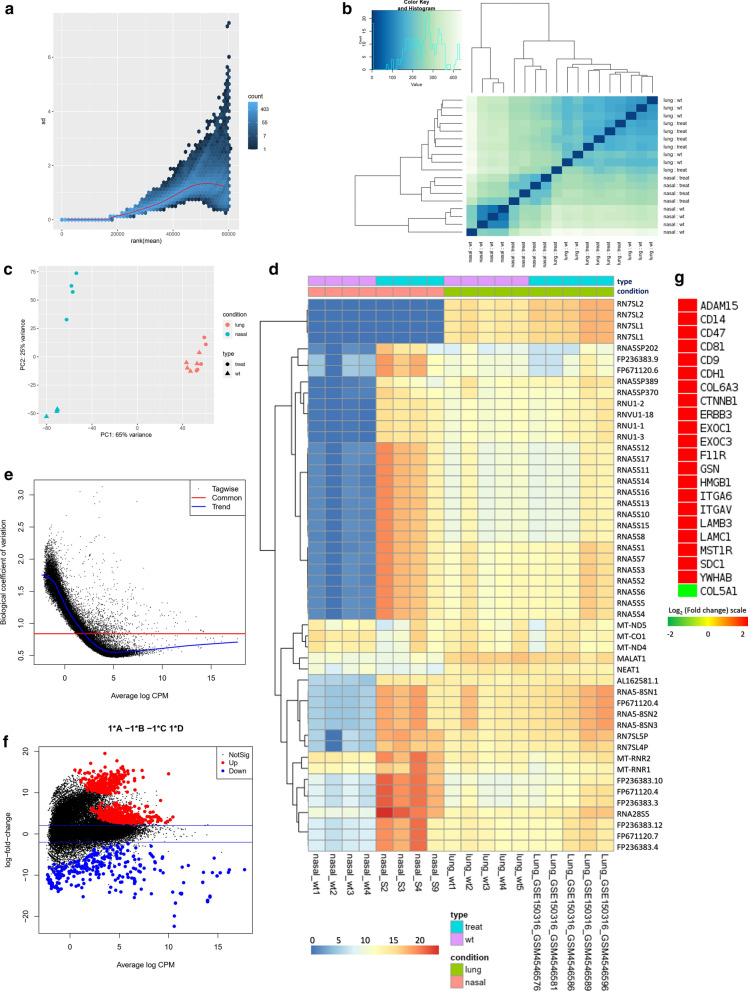
Fig. 7.
Multifactorial differential gene expression analysis using differentially expressed COVID-19 lung and nasal data. a Variance plot, b Sample to sample distance plot, c Principal component analysis plot, d Clustered heatmap of the count matrix of the normalized RNA-seq reads (top 50 genes) of the SARS-CoV-2 infected nasopharyngeal and lung samples. e Common dispersion plot or the biological coefficient of variation plot. Here we are estimating the dispersion. The square root of the common dispersion gives the coefficient of variation of biological variation. Here the coefficient of biological variation is around 0.8. f MA plot. Plot log-fold change against log-counts per million, with DE genes are highlighted. The blue lines indicate twofold changes. Red and blue points indicate genes with P-value less than 0.05. g Expression profiles of genes encoding Integrins. Log2 (fold change) values are considered as the expression values of the genes and represented in a color-coded scale; Color towards red indicating higher expression, while color towards green indicating little to no expression

