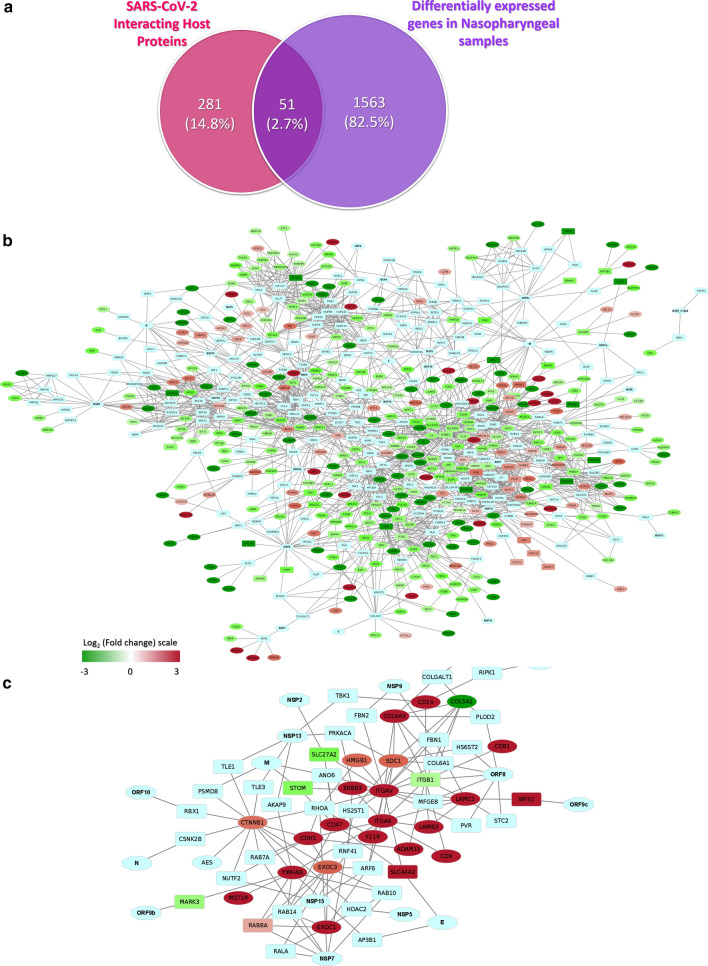
Fig. 9.
Interactions between SARS-CoV-2 proteins and differentially expressed genes of host. a Venn diagram showing the commonly deregulated genes between deregulated genes in our nasopharyngeal samples and Gordon et al. reported viral protein-interacting high confidence host proteins. Network representing the interactions between genes in b. Deregulated genes in nasopharyngeal samples along with SARS-CoV-2 proteins and Gordon et al. described viral interacting host proteins, and c Differentially expressed Integrin related genes in lungs compared to the nasal samples along with SARS-CoV-2 proteins and Gordon et al. described viral interacting host proteins. Hexagon, ellipse, rounded rectangle represents viral proteins, process-related genes, and proteins that interact with viral proteins, respectively. Expression values of the genes and represented in a color-coded scale. Color towards red indicating higher expression, while color towards green indicating little to no expression

