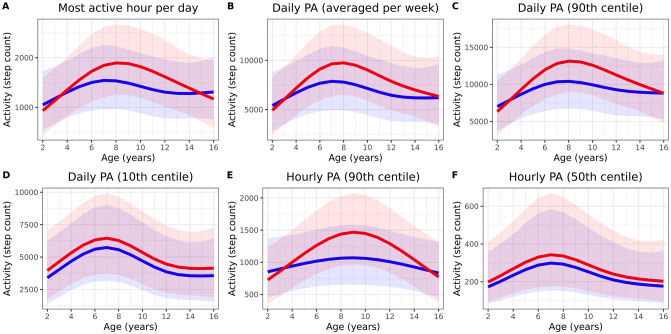
Fig 2. Prediction interval of physical activity candidate endpoints.
Prediction interval of several physical-activity related candidate endpoints. Red and blue line represent the estimated mean for male subjects and female subjects, respectively. The shaded areas represent the 90% prediction intervals where watch wear time (100%), rain duration (2h) and temperature (11°C) are held constant.

