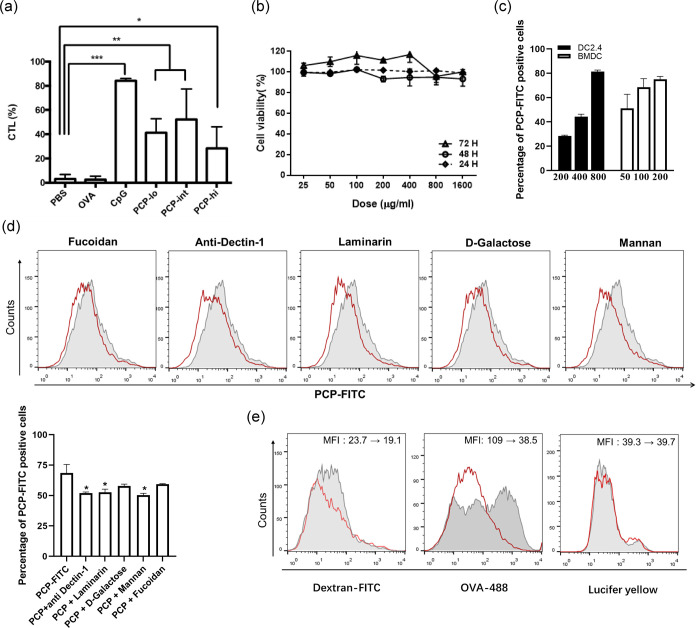
Fig 2. Cytotoxicity, uptake and enhanced CTL killing of PCP.
(a) Mice were immunized s.c. with 10 μg OVA mixed with CpG (10 μg) or different concentrations of PCP (250 μg, 500 μg and 1 mg per mouse). On day 6, target cells were pulsed with or without OVA peptide (257–264) and stained with low or high concentrations of CFSE, two populations were mixed at a ratio of 1:1 and injected i.v. to immunized mice. After 24 h, splenocytes were harvested and analyzed by FACS analysis. The percentage of OVA specific killing were calculated and expressed as mean ± SD. (b) DC2.4 cells were incubated with PCP ranging from 0 to 1.6 mg/mL, cell viability was evaluated by CCK-8 assay at 24 h, 48 h and 72 h. (c) DC2.4 cells were incubated PCP-FITC at 200, 400 and 800 μg/mL, BMDCs were incubated PCP-FITC at 50, 100 and 200 μg/mL. Cells were harvested and analyzed by FACS. Data are expressed as percentage of FITC positive cells. (d) BMDCs were pre-incubated with fucoidan (200 μg/mL), anti-mouse Dectin-1 antibody (20 μg/mL), laminarin (200 μg/mL), D-Galactose (200 μg/mL) or mannan (200 μg/mL) for 30 min before PCP-FITC incubation, cells were harvested for FACS analysis. The histograms represent PCP uptake by untreated cells (grey area), and cells pre-incubated with multiple inhibitors (red line). The bar graph shows the percentage of PCP-FITC positive cells. (e) BMDCs were co-cultured with OVA-Atto 488 (5 μg/ml), Dextran-FITC (MW 40,000, 100 μg/ml) or Lucifer yellow VS dilithium salt (LY, 100 μg/ml) after pre-incubation with PCP (100 μg/mL). The uptake of OVA, Dextran and LY were shown in histograms (grey area: no pre-incubation with PCP, red line: cells incubated with PCP). All data are representative of 2–3 independent experiments. *, P ≤ 0.05, **, P≤ 0.01, ***, P≤ 0.001 vs PBS control.

