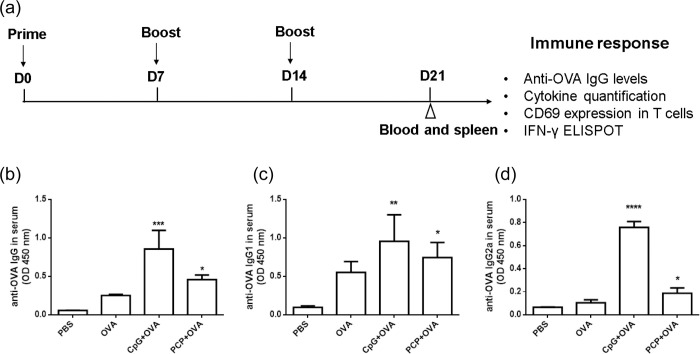
Fig 3. PCP induced OVA specific IgG antibody production.
(a) Timeline representation of immunization schedule. Mice were immunized 3 times (s.c.) with 10 μg OVA mixed with CpG (10 μg) or PCP (500 μg) with oneweek intervals between prime and boost. Blood and spleens were collected at day 21. OVA-specific IgG (b), IgG1 (c) and IgG2a (d) antibodies in serum were assayed by ELISA assay. The graphs show absorbance at 450 nm (OD 450 nm). *, P ≤ 0.05, **, P ≤ 0.01, ***, P≤ 0.001, ****, P≤ 0.0001 vs control.

