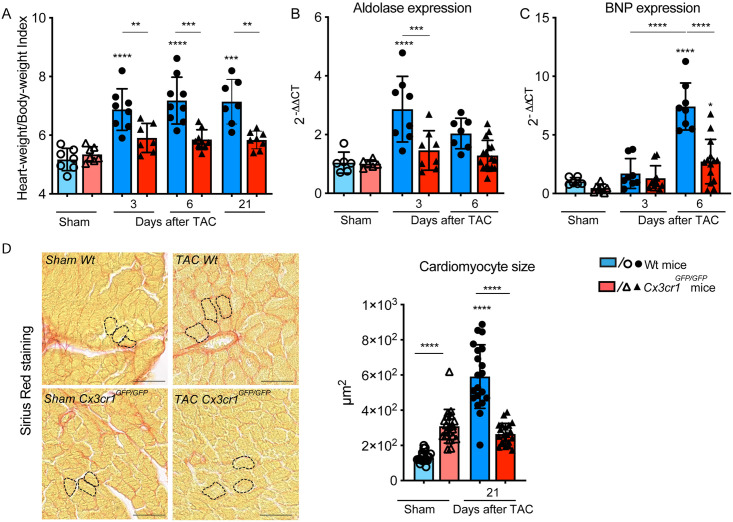
Fig 2. CX3CR1 expression modulates the development of LV hypertrophy in response to pressure overload.
(A) Heart-Weight/Body-Weight-Index of Wt and Cx3cr1GFP/GFP mice calculated 3, 6 and 21 days after transverse aortic constriction (TAC) and sham operation; n = 7–9 mice/group. (B) Aldolase mRNA expression pattern in LV tissue determined 3 and 6 days after TAC and sham operation in Wt and Cx3cr1GFP/GFP mice; n = 6–14 mice/group. (C) BNP mRNA expression pattern in LV tissue determined 3 and 6 days after TAC and sham operation in Wt and Cx3cr1GFP/GFP mice; n = 6–14 mice/group. (D) Representative sections of the left ventricle stained with sirious red of Wt and Cx3cr1GFP/GFP mice 21 days after TAC or Sham operation to determine cardiomyocyte size. Dashed lines highlight exemplary individual cardiomyocytes; scale bar indicating 50μm. Quantification of cardiomyocyte size by area planimetry; n = 5–6 mice/group, 4 slides per mouse were randomly analyzed by manual cell count of at least 50 cells/slide and mean was used for statistical analysis. * above individual columns indicate significant differences between TAC and respective sham group; **P<0.01, *** P<0.001, ****p < 0.0001.

