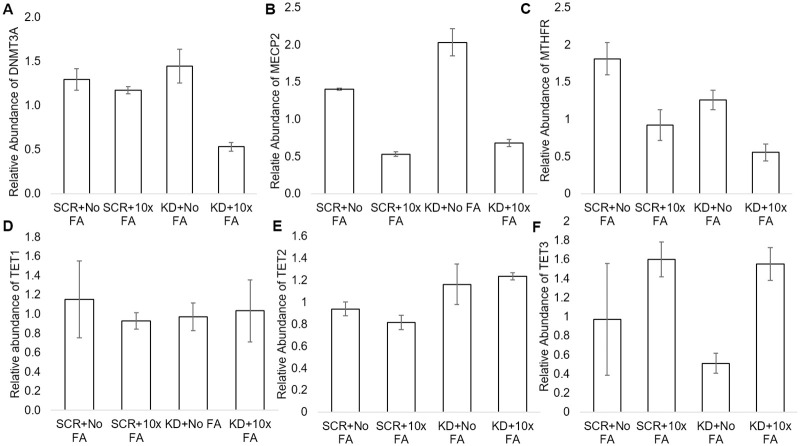
Fig 3. Gene expression of genes tested via Taqman assays in SCR, SCR+10xFA, KD, and KD+10x FA treatment groups.
SCR refers to scramble + no FA treatment, SCR+10x FA refers to scramble +10x FA treatment, KD refers to MTHFR knockdown, and KD+10x FA refers to the MTHFR knockdown+10xFA treatment group. A. Relative abundance of DNMT3A in all test groups. B. Relative abundance of MECP2 in all test groups. C. Relative abundance of MTHFR in all test groups. D. Relative abundance of TET1 in all test groups. E. Relative abundance of TET2 in all test groups. F. Relative abundance of TET3 in all test groups. N = 3 for each treatment group. * = p<0.05, ** = p<0.01. Error bars indicate +/- 1 Standard Deviation.

