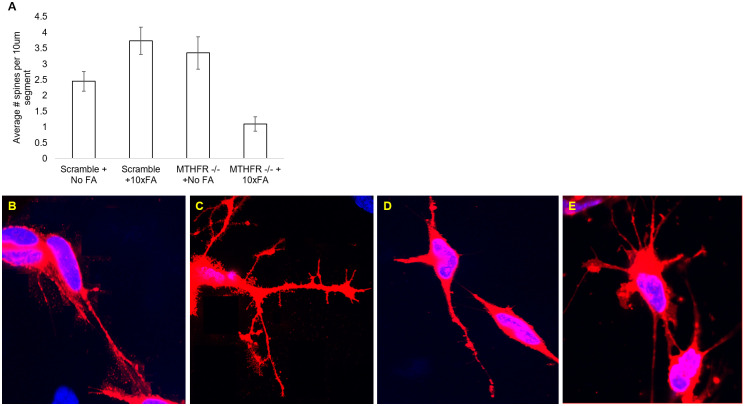
Fig 4. Dendritic spine densities in the scramble + no FA treatment, scramble +10x FA treatment, MTHFR -/- + No FA treatment, and the MTHFR -/- +10x FA treatment group.
A. Dendritic spine densities (average) per 10um segment in each test group. B. Representative image of dendritic spines in the scramble + no FA group. C. Representative image of dendritic spines in the scramble + 10x FA group. D. Representative image of dendritic spines in the MTHFR-/- + no FA group. E. Representative image of dendritic spines in the MTHFR-/- + 10x FA group. N = 3 for each treatment group. * = p<0.05, ** = p<0.01. Error bars indicate +/- 1 Standard Deviation.

