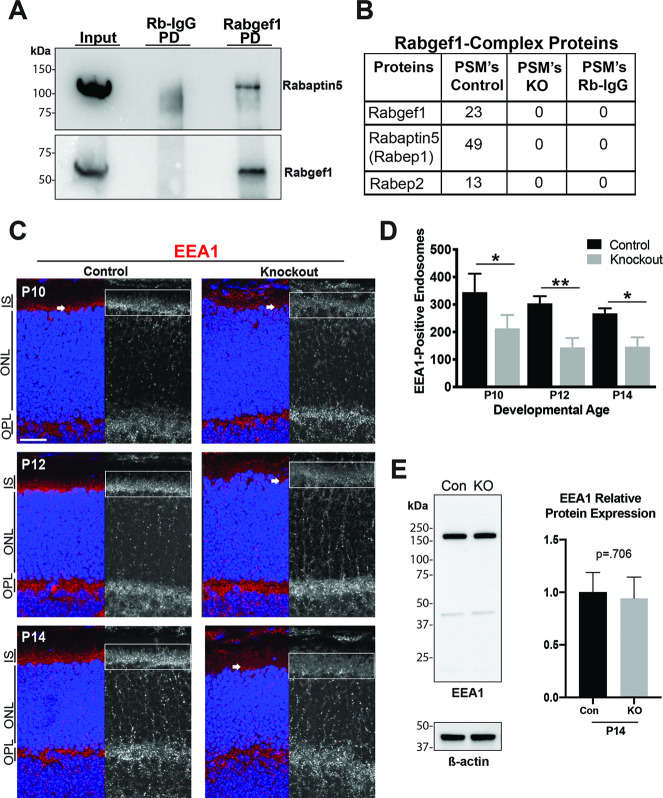
Fig 5. Conserved endocytic function of RabGEF1 in the retina.
(A) Immunoblot analyses of Rabbit-IgG and anti-RabGEF1 pulldown (PD) protein complexes (from 40 μg retinal lysate) with antibodies against RabGEF1 and Rabaptin5. Input was 3% of the protein from the control P21 mouse retinal lysate. Rabbit-IgG served as a negative control. (B) Mass spectrometry analysis of RabGEF1 co-immunoprecipitated proteins from P21 control and Rabgef1-/- retinas. RabGEF1 binds to Rabaptin-5 in a 1:2 ratio respectively (n = 2). (C) Immunohistochemistry with anti-EEA1 antibody on control and Rabgef1-/- retinal slices. Retinal sections were counterstained with DAPI. IS, inner segment; ONL, outer nuclear layer; OPL, outer plexiform layer. Scale bar = 20 μm. Boxed areas indicate regions of retina that were quantified, also shown at larger scale in S5B Fig. (D) Quantitative measurements of EEA1-positive endosomes at P10, 12 and 14 control and Rabgef1-/- individual z-stack images of the inner segment regions. (E) Immunoblot of control and Rabgef1-/- P14 retinal lysates probed with anti-EEA1. Anti-beta-actin was used as a loading control. There is no significant difference between EEA1 protein amounts in control and Rabgef1-/- retinal lysates Asterisks indicate p-value < 0.05 (*) and < 0.01 (**) as determined by t-test using Prizm software. In panels D and E, n = 3 biological replicates. Error bars indicate SD.

