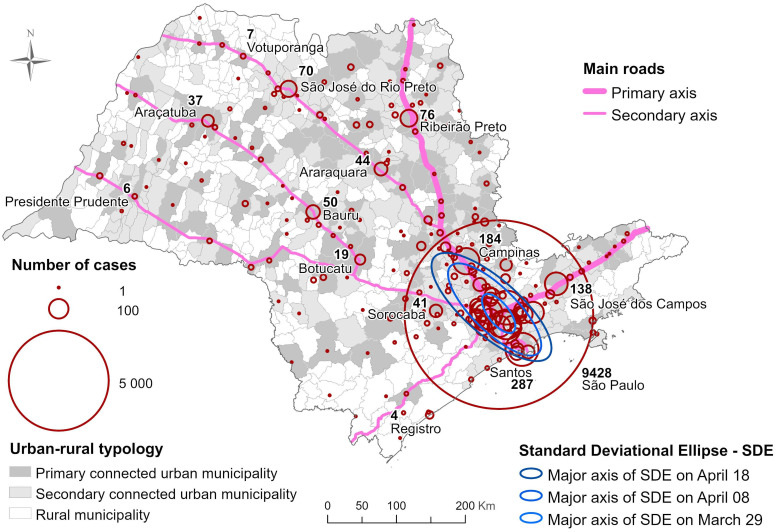
Fig 1. Distribution of confirmed COVID-19 cases in São Paulo State as of April 18th 2020, Brazil.
The size of the circles is proportional to the number of cases reported in each municipality. The map also shows the main roads that cross the state, the typology of each municipality, and the direction of disease spread on three different moments of epidemic course. The map was made using the software ArcGIS (version 10.8).

