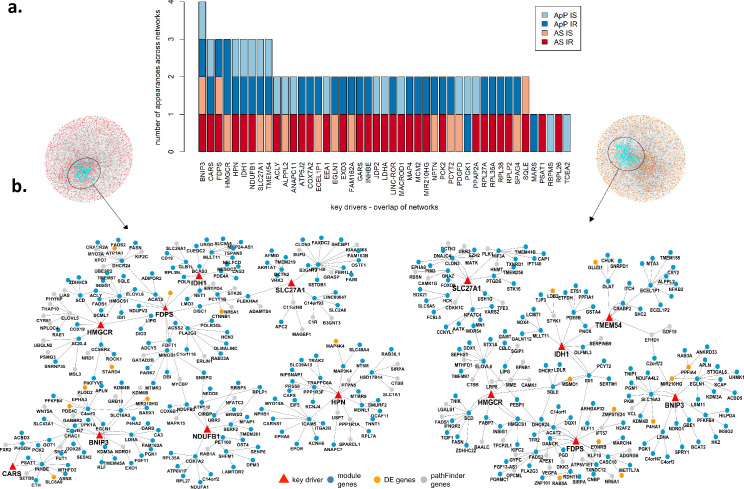
Fig 4. Predictive Causal Network (PCN), key drivers and sub-networks of the tested key drivers.
(a) key driver replication across networks. For each network a given gene can be identified as a KD based on the co-expression modules and/or the DE genes, and the more often a gene is identified as KD across networks, the stronger the evidence it is implicated in the phenotype; (b) sub-networks of top 9 key drivers for IR AS (left) and IS AS (right). We highlight the key drivers (red triangles) and the 2 step downstream genes. Genes from selected modules (blue), DE genes (orange) and expanded genes through pathFinder (grey).

