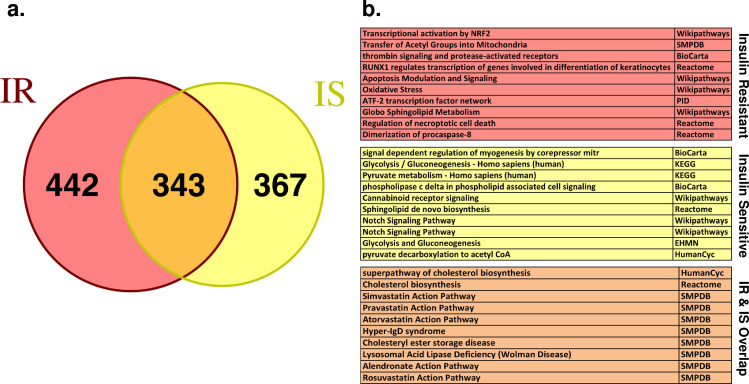
Fig 5. Differential pathway enrichment after HMGCR inhibition in IR vs IS iPSCs.
(a) Venn diagram for the IR-specific (442 genes), IS-specific (367 genes) and IR/IS overlapping (343 genes) DE genes due to HMGCR inhibition. (b) Pathway enrichments for the groups defined in (a). Top-10 significant pathways are shown for each group (full list of pathway enrichment can be found in S7 Table).

