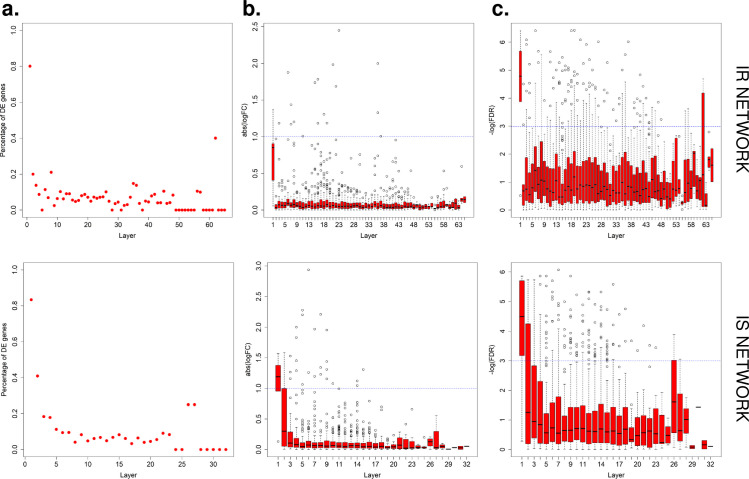
Fig 6. Predictive Network Validation (AS network) by RNA-seq data in Atorvastatin treated iPSC lines.
(a) The percentage of DE genes decreases as the distance (layers) from HMGCR increases. (b) Among the genes located downstream of HMGCR, the fold change decreases as the distance to HMGCR increases. (c) The p-value of differential expression analysis from Atorvastatin experiment decreases along the steps down from HMGCR. Upper lane: AS IR network. Lower lane: AS IS network.

