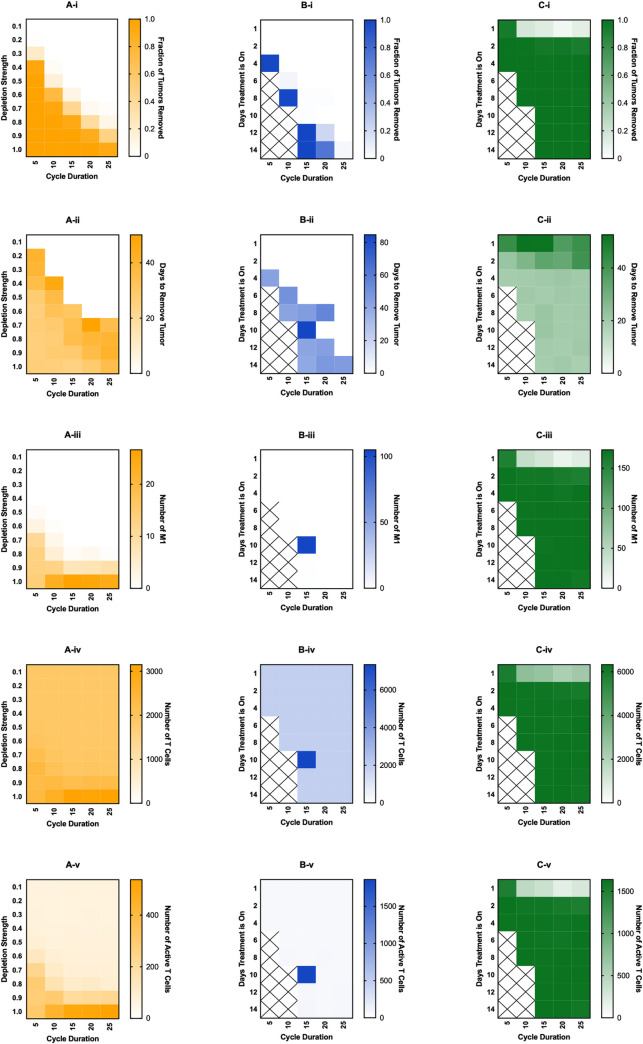
Fig 4. Effects of cycled immunotherapy started at 100 days of simulation.
For macrophage depletion (A), the fraction of macrophages removed at the beginning of each cycle is given as “Depletion Strength” and the length of each cycle is “Cycle Duration.” For recruitment inhibition (B) and PI3K inhibition (C), the number of days in the cycle that treatment is on for is given as “Days Treatment is On.” Recruitment inhibition is simulated at a strength of 1.0 (complete inhibition) and PI3K inhibition is simulated at a strength of 0.8. For recruitment inhibition and PI3K inhibition, spaces marked with an X are those where treatment-on time is equal or greater to the cycle duration, thus were not simulated. (i) fraction of tumors removed after starting therapy. (ii) time (days) from starting treatment to tumor removal. It is averaged over the 100 simulations and is equal to zero if no tumors were removed at that treatment level. (iii) maximum number of M1 macrophages. (iv) maximum number of total T cells. (v) maximum number of active T cells.

