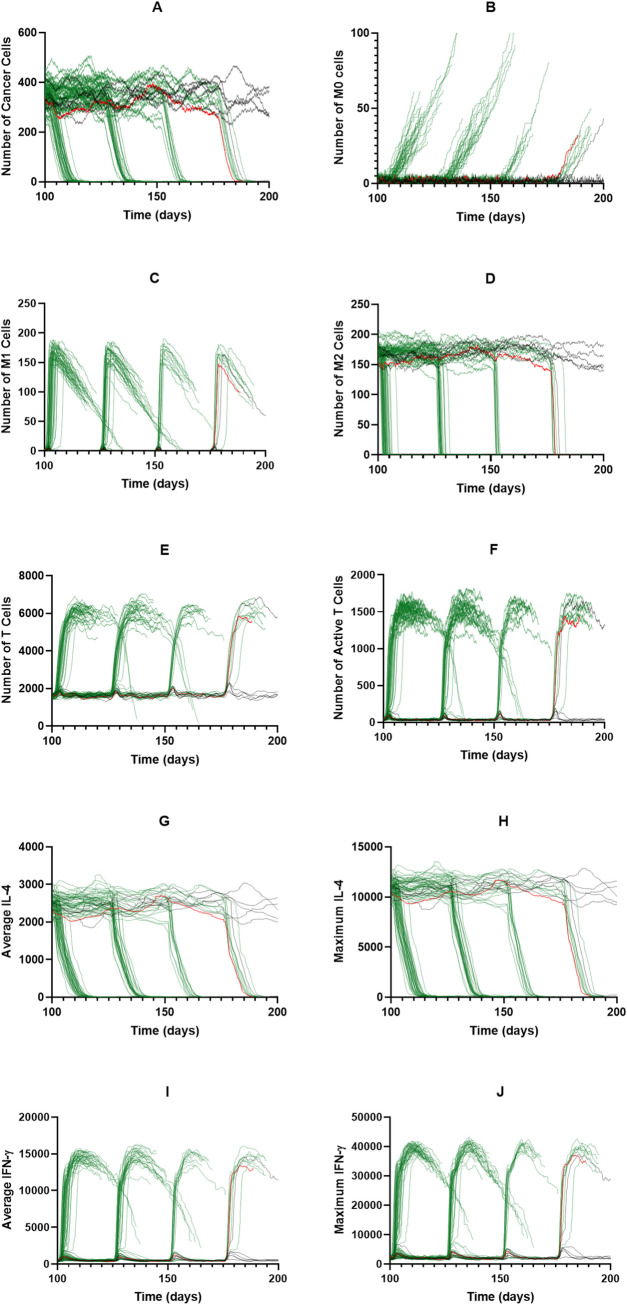
Fig 5. PI3K inhibition of 0.8 for cycled immunotherapy.
Individual time courses for PI3K inhibition of 0.8 at a cycle duration of 25 days with treatment given for 2 days per cycle. Tumors that survived to the end of simulation are shown in black. Tumors that were eliminated are shown in green. One time course is shown in red for ease of understanding. (A) Cancer cells, (B) M0 macrophages, (C) M1 macrophages, (D) M2 macrophages, (E) T cells, (F) Active T cells, (G) Average IL-4, (H) Maximum IL-4, (I) Average IFN-γ, (J) Maximum IFN-γ.

