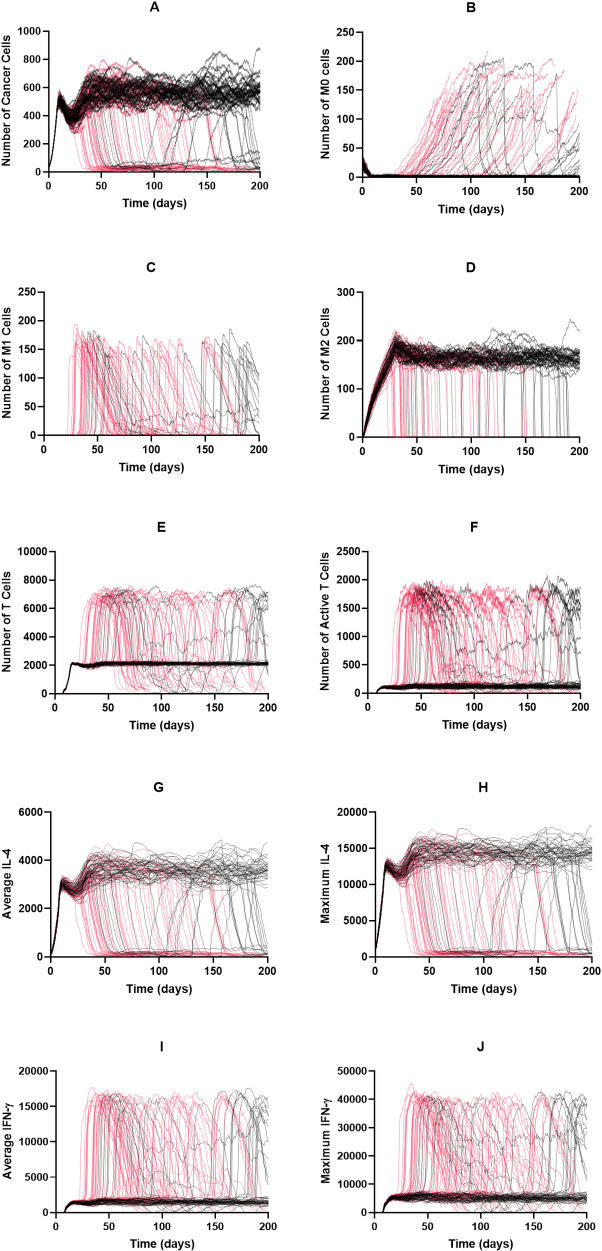
Fig 6. Time courses with increased tumor proliferation rate and no treatment.
The tumor proliferation rate is increased to 1.2/day. Time courses for tumors that were not removed by the immune system are shown in black; those for tumors that were removed are shown in red. (A) Cancer cells, (B) M0 cells, (C) M1 cells, (D) M2 cells, (E) Total T cells, (F) Active T cells, (G) Average IL-4, (H) Maximum IL-4, (I) Average IFN-γ, (J) Maximum IFN-γ.

