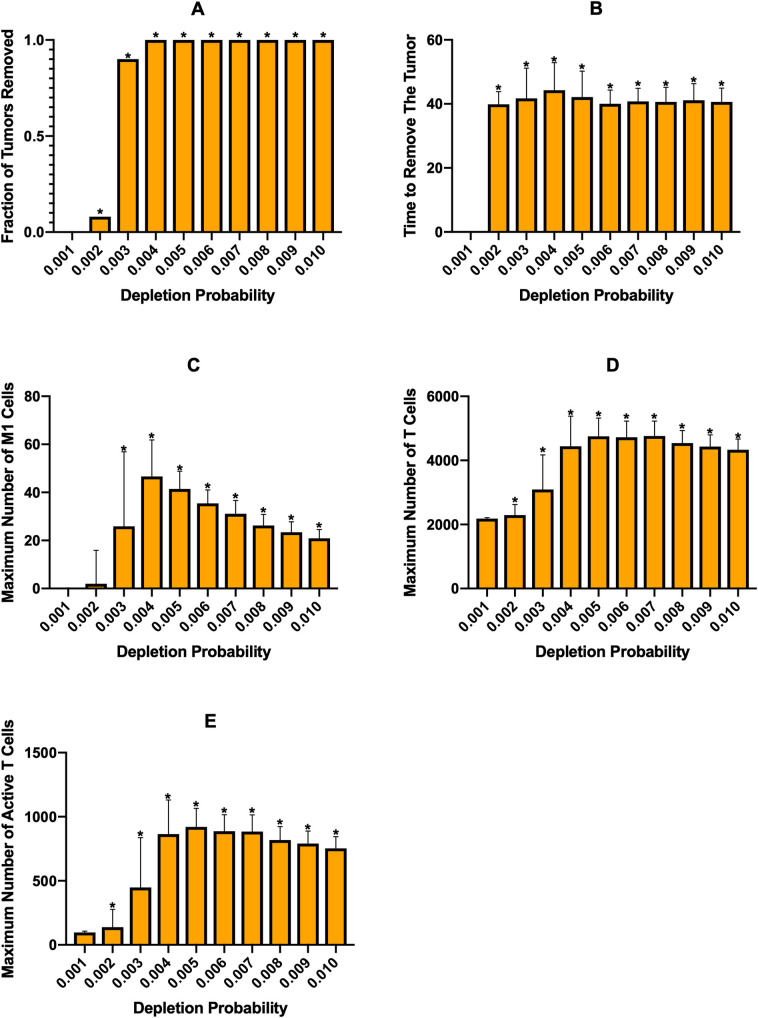
Fig 9. Constant macrophage depletion started at 100 days with macrophage recruitment rate doubled.
(A) fraction of tumors removed after starting simulation, (B) average time needed to remove the tumor, (C) the maximum number of M1 macrophages, (D) the maximum number of total T cells, (E) the maximum number of active T cells. Note the differences in y-axis scales across treatment strategies. Asterisks signify that a result is statistically significant (p<0.01) from the result of the lowest treatment strength. We note that for the time needed to remove the tumor (B), plotted is the time averaged over only simulations where the tumor was removed. Therefore, while some bars may appear much higher than that of the lowest treatment strength, they only represent a small number of simulations out of 100 and thus were not found to be statistically significant.

