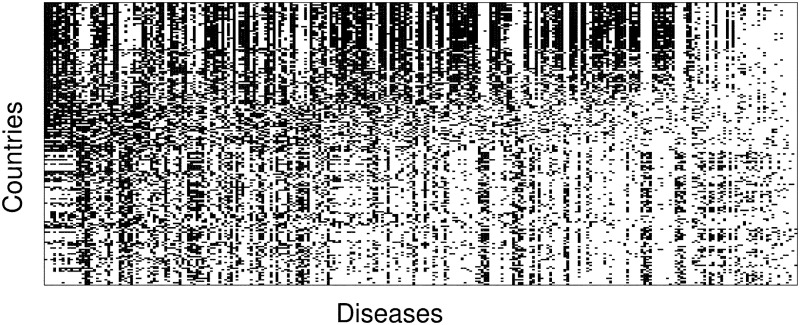
Fig 2. Matrix representation of the links between countries and diseases.
A visualization of this matrix for the year 2016, where a dark point indicates that country c has an RDD in a given disease d. The matrix is sorted by row and column sums. While the existence of countries that are very well diversified and countries that have a relative disease disadvantage only in a small set of diseases is clear, we would like to note that contrary to applications of this methodology to country-export data, for the disease prevalence this matrix is not clearly triangular (or nested).

