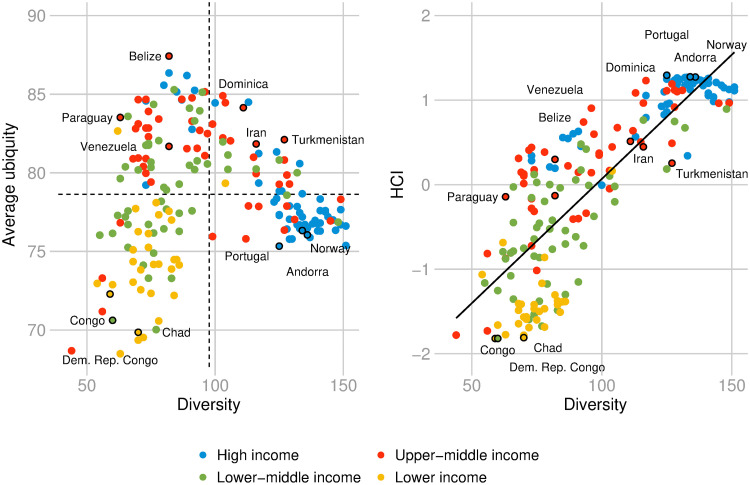
Fig 4. Average ubiquity, diversity, and the HCI.
Left panel: Relationship between diversity and average ubiquity. The diagram is divided into 4 quadrants defined by the empirical observed averages of diversity and average ubiquity; Right panel: Relationship between diversity and HCI. The colors depict different income-regions of the world according to World Bank’s classification. Data for 2016.

