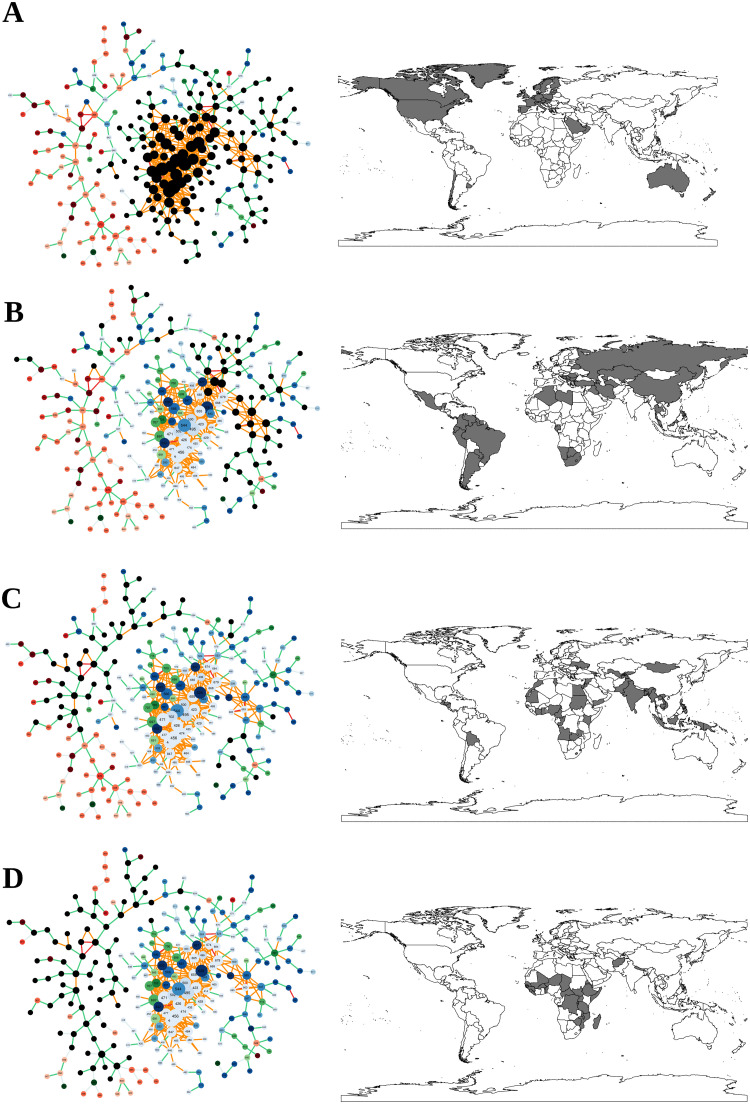
Fig 8. Localisation of diseases for different income-regions of the world.
A: High income, B: Upper-middle income, C: Lower-middle income, D: Low income. Diseases in an income-region where more than half of the countries belonging to this region have an RDD are shown with black nodes in the disease space network. Data for 2016.

