
Fig. 1: Detection of SARS-CoV-2 vRNA and infectious virus in mucosal swabs and BAL fluid.
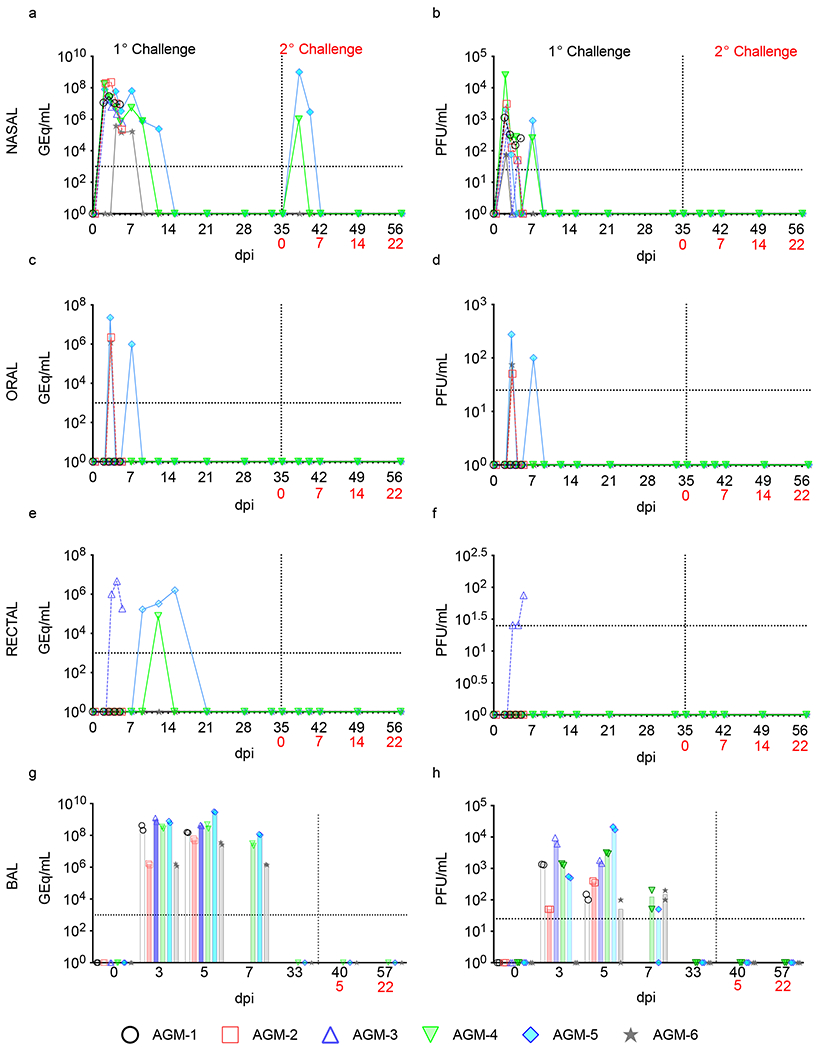
a,b) nasal swabs, c,d) oral swabs, e,f) rectal swabs, g,h) and BAL fluid from AGMs infected with SARS-CoV-2 were subjected to RT-qPCR (a,c,e,g) or plaque titration (b,d,f,h). For all graphs, dashed lines and open symbols (AGM-1, AGM-2, AGM-3) indicate AGMs sacrificed 5 dpi (n=3); solid lines (AGM-4, AGM-5, AGM-6) indicate AGMs held to 57 dpi or 22 days after re-challenge (n=3). Data plotted is each duplicate RT-qPCR reaction or well per subject/sample in a single experiment. Red text indicates day of back-challenge.