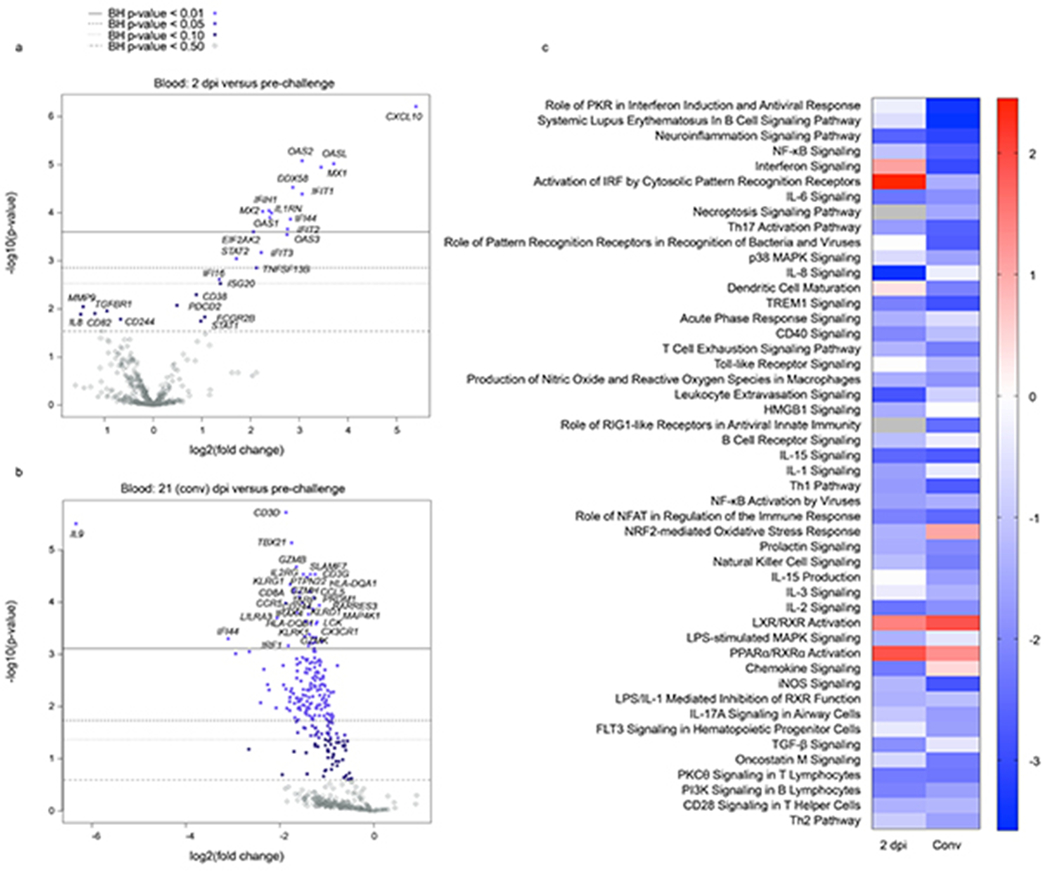
Extended Data Fig. 5. Early and convalescent stage transcriptional changes in SARS-CoV-2-infected AGMs.

a, b) Volcano plots and a c) heatmap indicating early and convalescent stage transcriptional changes in SARS-CoV-2-infected AGMs. a,b) Displayed are −log10(p-values) and log2 fold changes for each mRNA target. Horizontal lines within the plot indicate FDR-adjusted p-value thresholds. Targets highlighted in blue indicate adjusted p-values < 0.10. A Benjamini-Hochberg test was employed to derive FDR-adjusted p-values. c) Heatmap demonstrating the most highly upregulated and downregulated canonical pathways at each time point. Only differentially expressed transcripts with an FDR-corrected p-value of less than 0.1 were enriched with Ingenuity Pathway Analysis (Qiagen). The data were normalized against a day 0 pre-challenge baseline for each NHP subject. Red indicates high expression (z-scores); blue indicates low expression; white indicate similar expression; gray indicates insufficient transcripts mapping to the indicated pathway.
