
Extended Data Fig. 1. Longitudinal temperature analysis of AGMs infected with SARS-CoV-2.
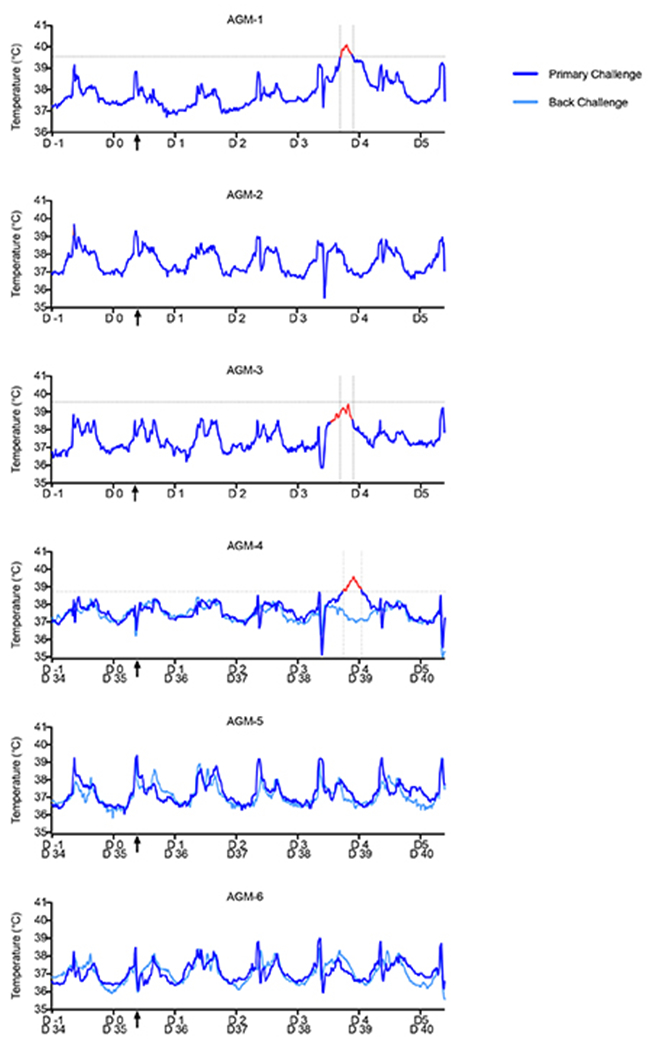
Prior to challenge, AGMs (n=6) were surgically implanted with a DST micro-T small implantable thermo logger (Star-Oddi), allowing body temperature measurements for each animal in 15-min increments (96 measurements/day) throughout the course of the study. AGM-1 and AGM-3 had elevated temperatures noticeably above baseline temperatures (1 day prior to challenge) at 3 dpi; AGM-4 exhibited increased temperature at 4 dpi. The “fever peak” for each subject is colored in red. Vertical dashed lines indicate the start and end of the fever peak. Horizontal dashed lines indicate the threshold temperature for classification as fever. Black arrows on the x-axis indicate time of challenge. Determination of the window of febrile temperatures was performed visually, with comparison of temperatures at all other points during the study duration (−1 dpi to 5 dpi).