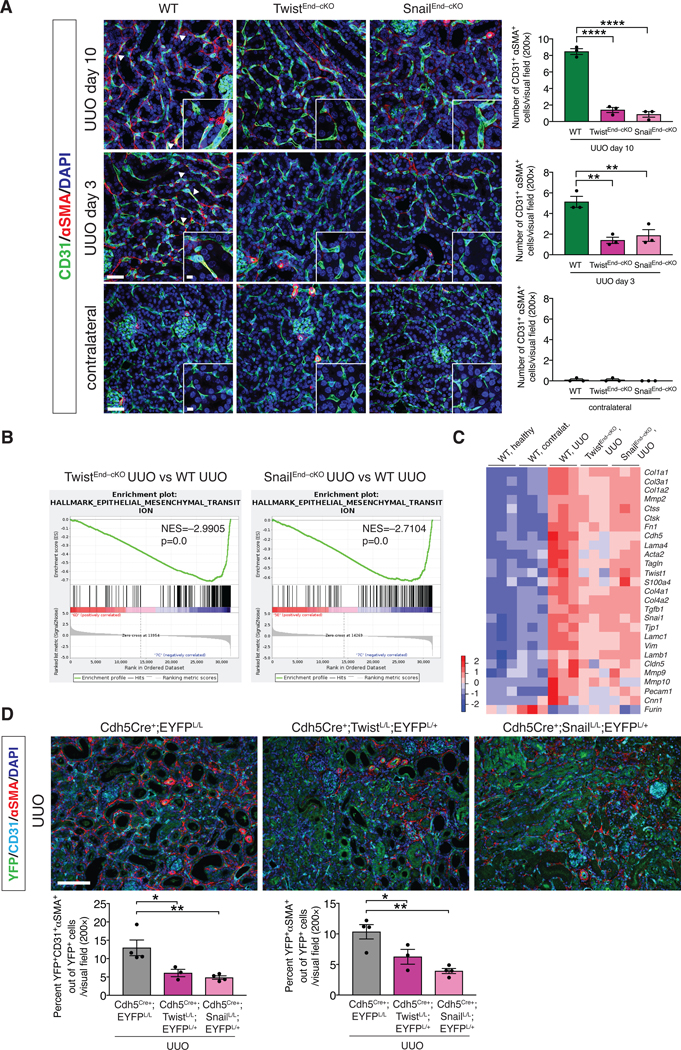
Figure 3. EndMT occurs in UUO-induced kidney fibrosis and is inhibited by the conditional deletion of Twist1 or Snai1.

(A) Maximum intensity orthogonal projections of CD31 and αSMA co-immunolabeling of UUO kidneys from the indicated experimental groups and respective quantification of the number of CD31+αSMA+ double positive cells per visual field (200×). Cre Ctrl, WT and TwistEnd–cKO, n = 3 mice; Cre Ctrl, WT and SnailEnd–cKO n = 3 mice. Scale bars: 40 μm. Insets: 10 μm. DAPI: nuclei. (B) GSEA enrichment plots of Hallmark gene dataset associated with epithelial-to-mesenchymal transition in the kidneys of TwistEnd–cKO UUO or SnailEnd–cKO UUO compared to WT UUO mice. All groups, n = 3 mice for each group. (C) Heatmap representing the intensity of expression of EndMT-associated Twist and Snail transcriptional target genes in the kidneys of the indicated experimental groups. Columns represent individual mouse kidney samples. All groups, n = 3 mice for each group. (D) Immunolabeling for YFP, CD31 and αSMA of UUO kidneys from the indicated experimental groups. Cdh5Cre+;EYFPL/L n = 4 mice, Cdh5Cre+;TwistL/L;EYFPL/+ n = 3 mice, Cdh5Cre+;Snai1L/L;EYFPL/+ n = 4 mice. Scale bars: 100 μm. Data is presented as mean ± s.e.m. One-way analysis of variance (ANOVA) with Tukey post-hoc analysis. *P < 0.05, **P < 0.01, ***P < 0.001.
