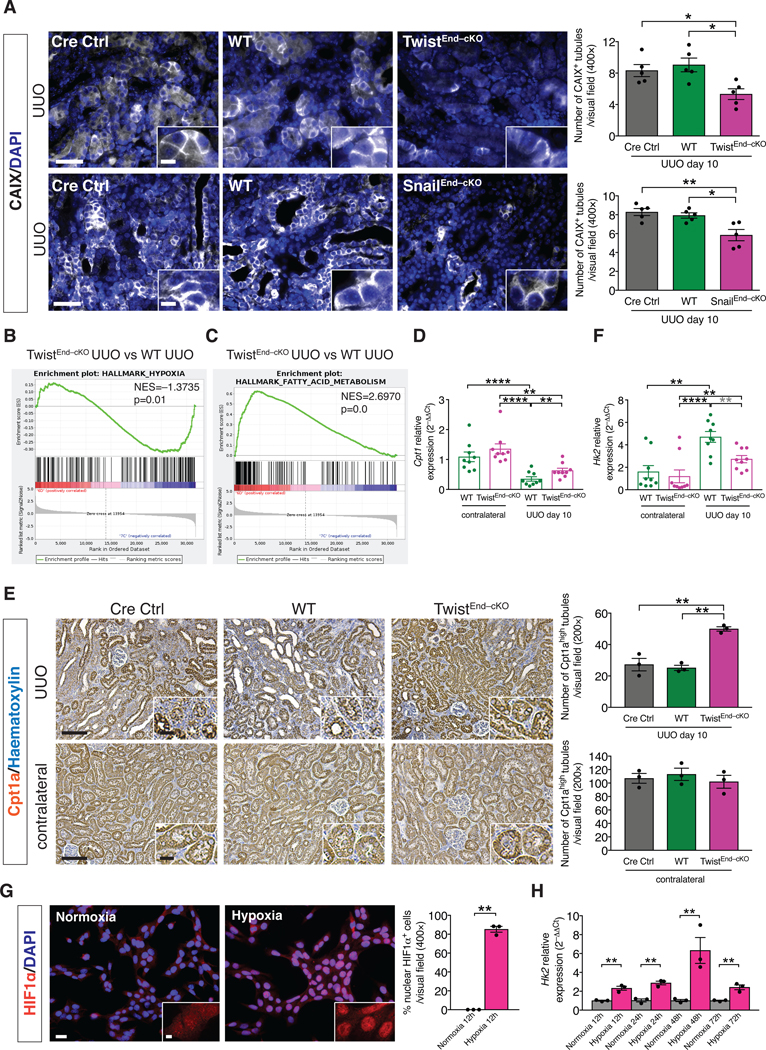
Figure 5. Blocking EndMT protects against tubular hypoxia and preserves metabolic homeostasis.

(A) Immunolabeling for the hypoxia marker CAIX of kidneys from the indicated experimental groups and respective quantification. All groups, n = 5 mice for each group. Scale bars: 50 μm. Insets: 12.5 μm. DAPI: nuclei. (B–C) GSEA enrichment plots of Hallmark gene dataset associated with hypoxia and fatty acid metabolism in the kidneys of TwistEnd–cKO UUO compared to WT UUO mice. All groups, n = 3 mice for each group. (D) Relative transcript levels of the metabolism-related gene Cpt1 (which encodes carnitine palmitoyltransferase 1A) in the kidneys of the indicated experimental groups. All groups, n = 9 mice for each group. (E) Immunohistochemistry analysis of the FAO marker Cpt1a in kidneys from the indicated experimental groups and respective quantification. All groups, n = 3 mice for each group. Scale bars: 100 μm. Insets: 25 μm. (F) Relative transcript levels of the metabolism-related gene Hk2 (which encodes hexokinase 2) in the kidneys of the indicated experimental groups. All groups, n = 9 mice for each group. (G) Immunolabeling for the hypoxia transcription factor HIF1α and relative quantification in MCT cells exposed to normoxia or hypoxia for 12 hrs. All groups, n = 3 biological replicates for each group. Scale bar: 20 μm. Insets: 5 μm. (H) Relative transcript level of Hk2 in MCT cells exposed to normoxia or hypoxia for 12 to 72 hrs. All groups, n = 3 biological replicates for each group. Data are presented as mean ± s.e.m. One-way analysis of variance (ANOVA) with Tukey post-hoc analysis with gray stars indicating the use of unpaired two-tailed t-test. Unpaired two-tailed Student’s t test (G–H). *P < 0.05, **P < 0.01, ****P < 0.0001.
