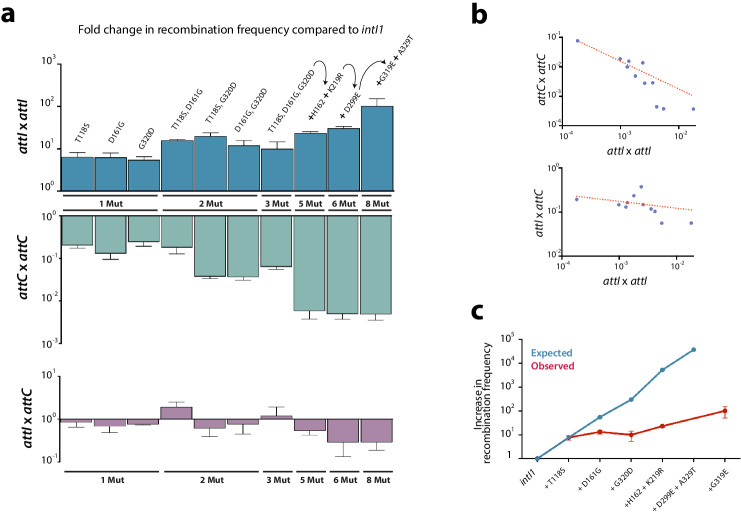
Figure 3. Construction of alleles with eight mutations.
(a) fold change in recombination rates for attI x attI, attC x attC, and attI x attC of intermediate steps in the construction of intI18mut containing a variety of combinations of mutations. Bars represent average values of at least three independent experiments. Error bars show standard error. Mutations are indicated only on top of blue bars but mutants are depicted in the same order among the three graphs. Arrows and the '+' symbol in 5x, 6x, and 8x mutants mean that mutations shown are added to those in the previous mutant. Strain numbers are found in Supplementary file 2. (b) negative correlation between the activity in attI x attI reactions and that in attC x attC (above) (Spearman test, r = −0.945, P (two-tailed) <0.0001; log-log regression R2: 0.973); and attI x attC reactions (below) (Spearman test, r = −0.654, P (two-tailed) = 0.0336; log-log regression R2: 0.13). (c) expected and observed increases in recombination rates among mutants containing subsets of the mutations in intI8mut. Expected values are obtained based on a multiplicative model in the absence of epistasis. The lower recombination rates observed are indicative of negative epistatic interactions among mutations.

