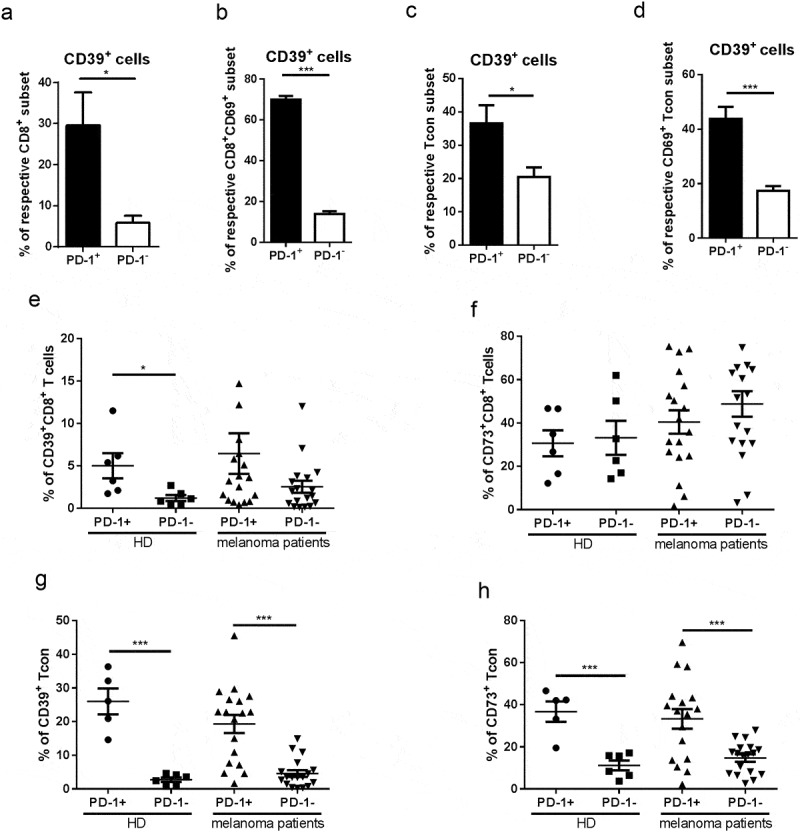
Figure 6.

Ectonucleotidase expression on PD-1+ T cells from melanoma-bearing hosts. Expression of CD39, CD69, and PD-1 was measured in CD8+ T cells (A, B) or CD4+FoxP3+ Tcon cells (C, D) from skin tumors of RET-tg mice (n = 6) by flow cytometry. The results are shown as the percentage of CD39+ cells within total PD-1+ or PD-1− T cells (A, C) or within PD-1+CD69+ or PD-1−CD69+ subsets (B, D). Expression of CD39, CD73 and PD-1 was tested in total CD8+ T cells (E, F) or CD4+FOXP3−CD25low/-CD127high Tcon (G, H) from the peripheral blood of melanoma patients (n = 18) and healthy donors (n = 6). The results are presented as the percentage of CD39+ and CD73+ cells among PD-1+ or PD-1− indicated subsets of T cells. *P < .05, ***P < .001
