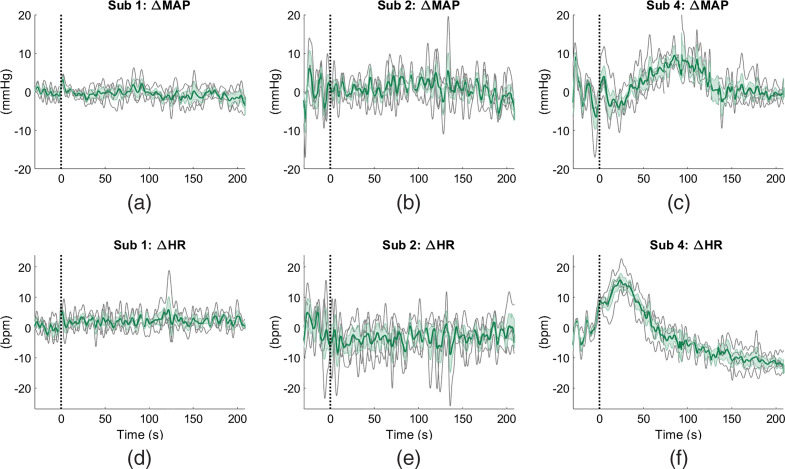
Fig. 4.
Average changes in HR and MAP across all sections of 2-back task for three subjects (1, 2, and 4). The time traces are shown starting from 30 s before the task. Black dotted lines indicate time s. Solid green lines are the averages across sessions in and ; standard errors of these averages are shown by the cyan shaded regions; solid gray lines depict the individual measurements.

