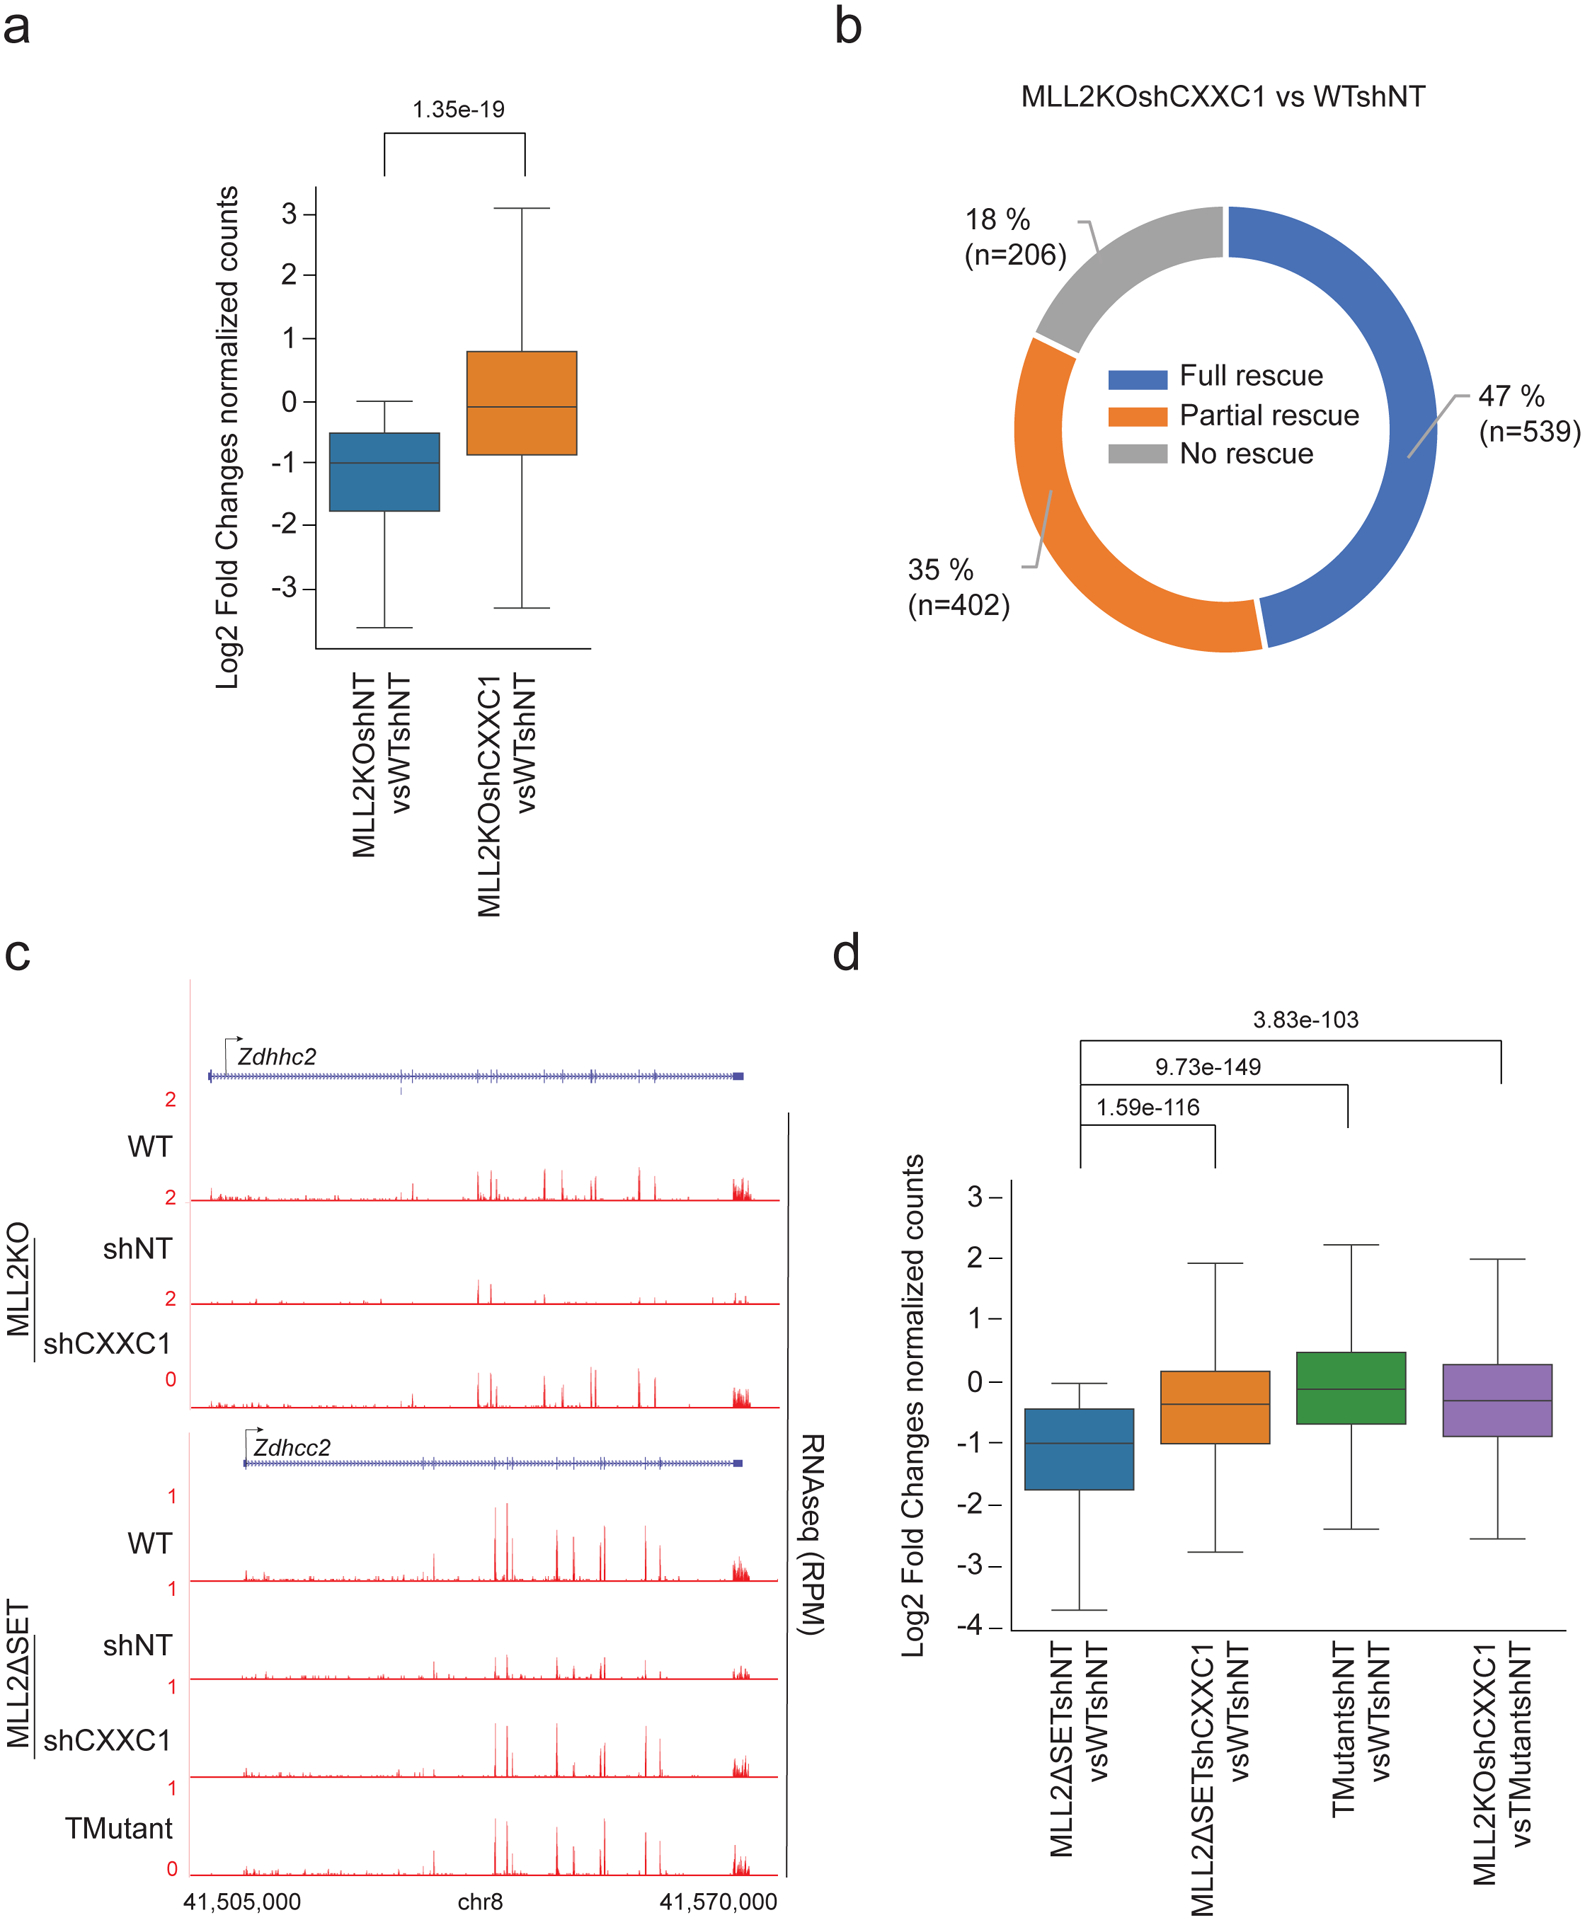
Extended Data Fig. 4. Cluster-1 gene expression rescue by CXXC1 knockdown.

(a) Boxplot analysis of cluster1 gene expression in 1) MLL2KOshNT vs. WTshNT mESCs and 2) MLL2KOshCXXC1 vs. WTshNT mESCs. P values were computed using Wilcoxon test (two-sided), n=941. The boxplots indicate the median (middle line), the third and first quartiles (box) and the first and fourth quartiles (error bars). (b) Donut chart of cluster 1 distribution of genes based on their level of rescue in MLL2KO shCXXC1 cells compared to WT cells. ‘Full rescue’ genes were characterized by a log2FC ≥ 0 comparing MLL2KOshCXXC1 to WT mESCs, ‘Partial rescue’ genes were characterized by a log2FC > 0 comparing MLL2KOshCXXC1 and MLL2KO mESCs and ‘No rescue’ were characterized by a log2FC ≤ 0 comparing MLL2KOshCXXC1 and MLL2KO mESCs. (c) RNA-seq tracks for Zdhhc2 in WT, MLL2KOshNT, MLL2KOshCXXC1, MLL2ΔSETshNT, MLL2ΔSETshCXXC1 and TMutant. The experiment was repeated two times independently with similar results. (d) Boxplot analysis of cluster1 gene expression in 1) MLL2ΔSETshNT vs. WTshNT mESCs and 2) MLL2ΔSETshCXXC1 vs. WTshNT mESCs, 3) TMutantshNT vs. WTshNT mESCs, 4) TMutantshCXXC1 vs. WTshNT mESCs and 5) MLL2KOshCXXC1 vsTMutantshNT mESCs (n=2).
