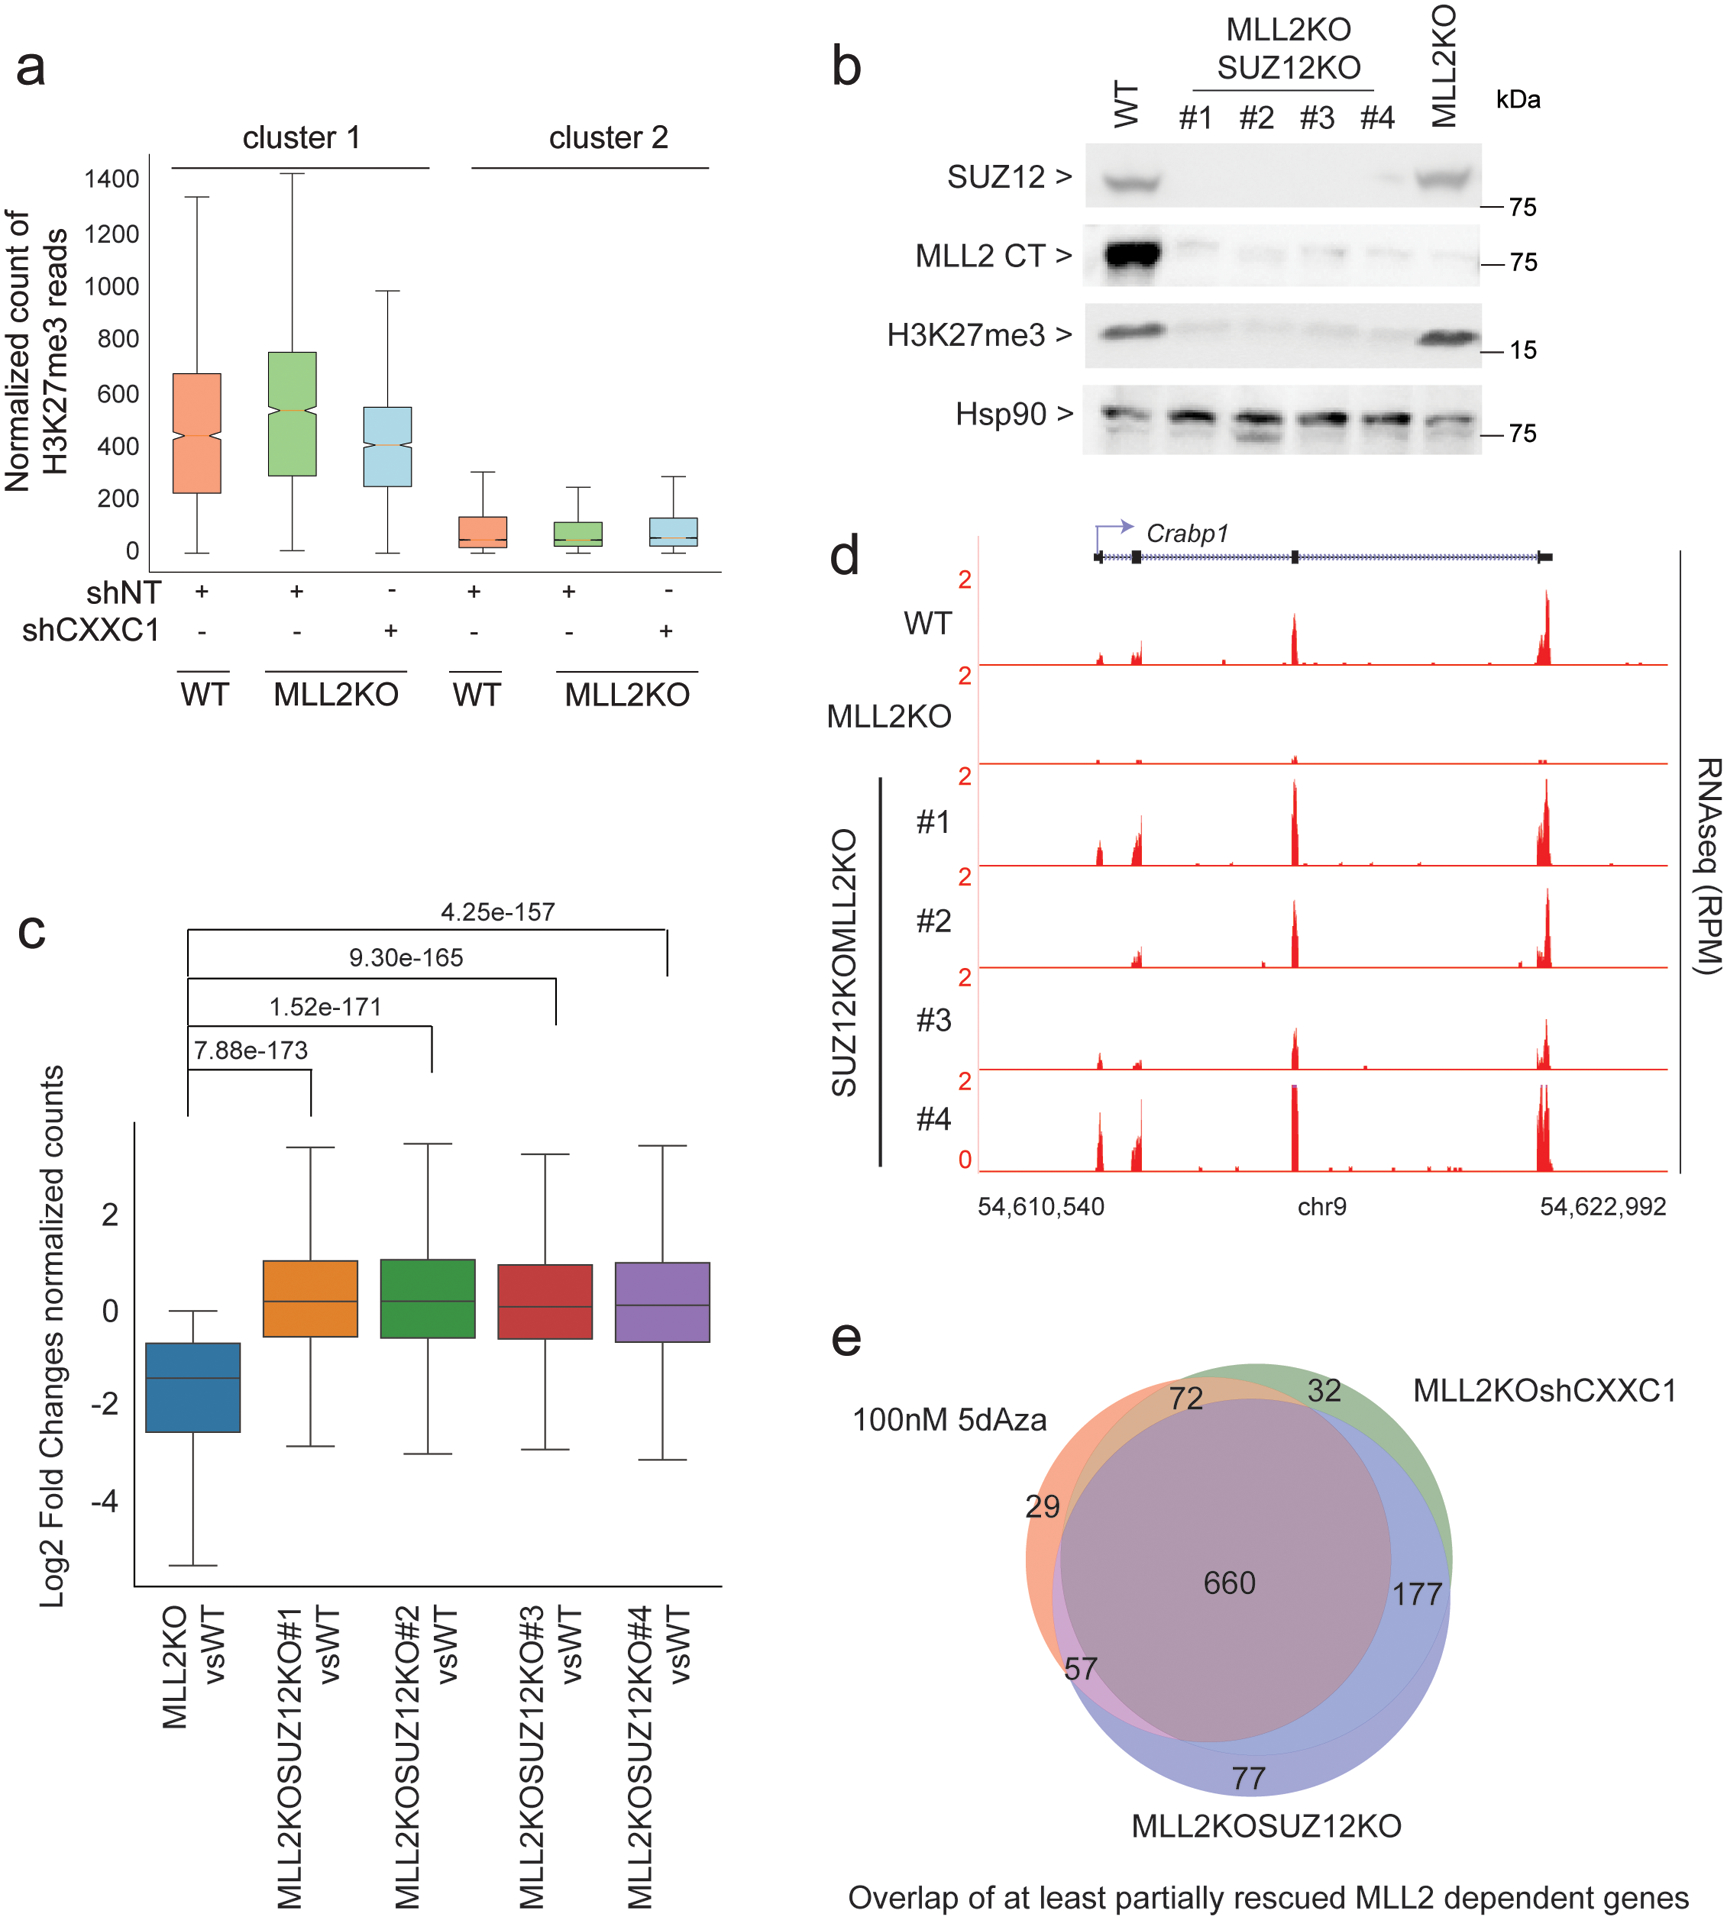
Fig. 6: Interplay of H3K27me3, DNA methylation and MLL2 for gene transcription.

(a) Boxplots quantifying H3K27me3 ChIP-seq signal around TSS (± 3 kb) are shown (n = 2). (b) Western blot of SUZ12, MLL2, H3K27me3 and HSP90 (loading control) protein levels in WT, MLL2 and SUZ12 double KO (4 clones) and MLL2 KO. The experiment was repeated two times independently with similar results. (c) Boxplot analysis of cluster1 gene expression in 1) MLL2 KO vs. WT mESCs and 2–5) MLL2 and SUZ12 double KO vs. WT mESCs (clone #1 to #4). P values were computed using Wilcoxon test (two-sided), n = 1,311. The boxplots indicate the median (middle line), the third and first quartiles (box) and the first and fourth quartiles (error bars). (d) RNA-seq track examples are shown for each clone. The experiment was repeated two times independently with similar results. (e) Venn diagram of RNA-seq comparing MLL2/SUZ12 KO or MLL2 KO shCXXC1 or MLL2 KO 5dAza-treated vs MLL2 KO. Left panel shows the overlap of partially rescued genes (< wild type expression) and right panel shows the overlap of fully rescued genes (= wild type expression level). Uncropped gels are available as source data.
