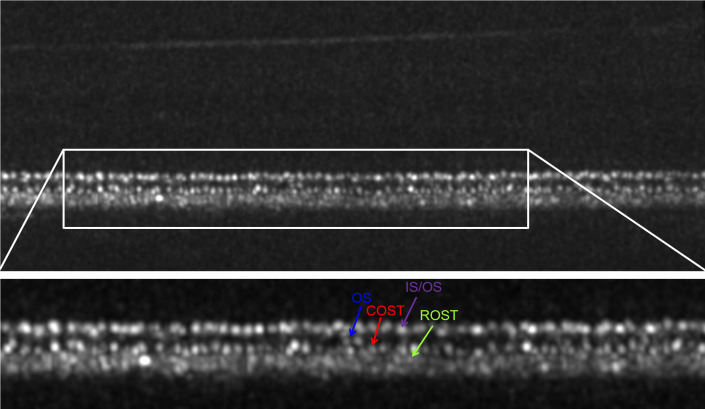
Fig 2. AO-OCT B-Scan with labelled photoreceptor layers.
Non-averaged image, linear brightness scale, location 6.5° superior eccentricity in a 26yo healthy male. The upper image shows the whole B-Scan. Note, how the inner retinal layers are barely visible due to their lower reflectivity in comparison to the outer retinal layers. Visualization of the inner retina can be improved by focusing the AO-OCT on the nerve fibre layer instead of the RPE, switching from a linear to a logarithmic brightness scale and averaging multiple B-Scans to a single image. The white rectangle shows the region of interest of the outer retina, which can be seen in the lower section of the image: The cone inner segment-outer segment junction (IS/OS) consists of bold dots (purple arrow) with hyper reflectivity and with oscillating intensity, ranging from grey to bright white. Below the IS/OS, the cone outer segments (OS) show mostly very faint and blurry signals; a few hyper-reflective spots can be seen (blue arrow), most likely defects in the packing density of the cone outer segment discs (Pircher et al. 2011). Below the OS, the cone outer segment tips (COST) show a similar pattern as the IS/OS, but the spots (red arrow) appear slightly smaller and better separated. The rod outer segment tips (ROST), are located directly below the COST; depiction in a non-averaged image is difficult due to their small size, however, some signals can be depicted (green arrows). Note: Due to its weak reflectivity, the external limiting membrane, which is located above the IS/OS, can barely be seen in linear brightness scale and non-averaged images.

